
Sage 100 includes built-in dashboard reporting tools that help users access charts, summaries, and key business information directly from the system. In this video, Rand Group walks through the Sage 100 Business Insights dashboard, including how to activate the dashboard, configure company settings, manage user access, and control which dashboard elements are displayed for different roles.
The demo also shows how users can refresh dashboard data, drill into records from dashboard views, and customize the information they see when they log in. Viewers will also learn how the Business Insights dashboard fits alongside other Sage 100 reporting options, including Crystal Reports, Business Insights Explorer views, advanced lookups, Sage Intelligence, Sage Data & Analytics, Sage Enterprise Intelligence, and Power BI. Explore the earlier videos in the series by watching Part 1 and Part 2 of Sage 100 Business Insights Explorer.
In this video you’ll learn:
Activate and configure the Sage 100 Business Insights dashboard for your company
Customize dashboard views by user so teams can see role-specific financial, sales, payables, receivables, and performance data
Explore additional Sage 100 reporting options, including Crystal Reports, Sage Intelligence, Sage Data & Analytics, and Power BI
Related Videos
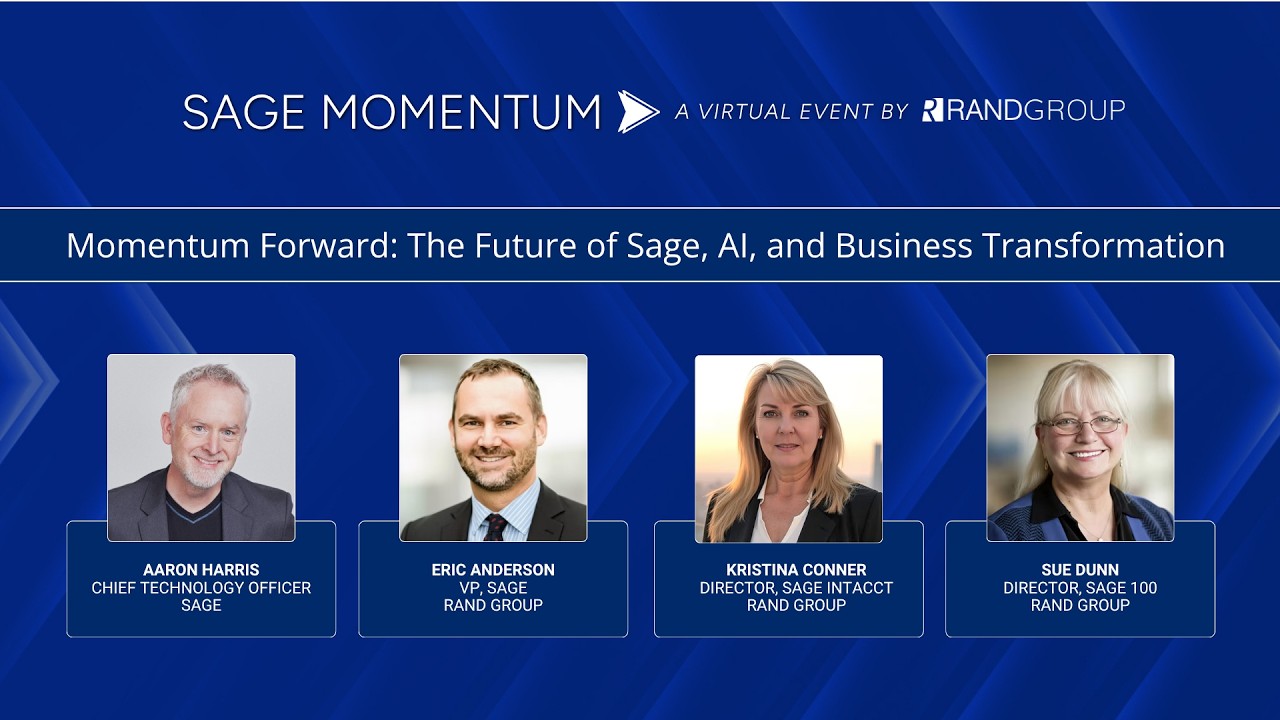
Momentum forward: The future of Sage, AI, and business transformation
Learn how Sage is approaching AI, automation, and financial software innovation across Sage Intacct and Sage 100. This keynote discussion covers trustworthy AI, agentic technology, human oversight, and how organizations can evaluate the right Sage solution for their needs.

Sage 100 warehouse management — transform your warehouse management
Learn how ScanForce warehouse automation helps Sage 100 users improve inventory accuracy, streamline receiving and picking, and reduce manual warehouse processes. This video covers barcode scanning, multi-bin inventory, directed picking, manufacturing transactions, and more.

Sage 100 cloud hosting: Secure your Sage 100 environment in the cloud
Discover how Cloud at Work and Rand Group help Sage 100 users modernize their IT infrastructure with secure cloud hosting, virtual desktops, managed services, and cybersecurity solutions. Learn how businesses can simplify operations, support remote work, and reduce upgrade costs with a seamless transition to the cloud.