What is NetSuite SuiteAnalytics Workbook?

Analytics provide important data that businesses need to make informed decisions. Without accurate and timely information, organizations may miss spotting patterns or issues that affect business outcomes. NetSuite comes with a set of reporting tools called SuiteAnalytics that includes features such as saved searches, reporting, KPIs, and dashboards. The latest feature included in the suite is Workbook — a new tool that allows users to more easily explore their data.
What is SuiteAnalytics Workbook?
Workbook is the newest feature included in SuiteAnalytics that was released with NetSuite 2019.1. It provides an alternative to saved searches and reports which use separate data sources and interfaces. Workbook instead combines searching, reporting, and charting in a single tool, allowing users to explore their data in one place. With Workbook, you can group together any type of data available in NetSuite and then create pivot tables or charts to visually explore that data. The advantage of Workbook is users without high levels of technical training or know-how can perform these complex queries and receive the answers they are looking for. With a simple way to manipulate, view, and interact with data, all NetSuite users have access to methods that allow them to identify patterns in their data or grasp difficult concepts.
How do you use Workbook?
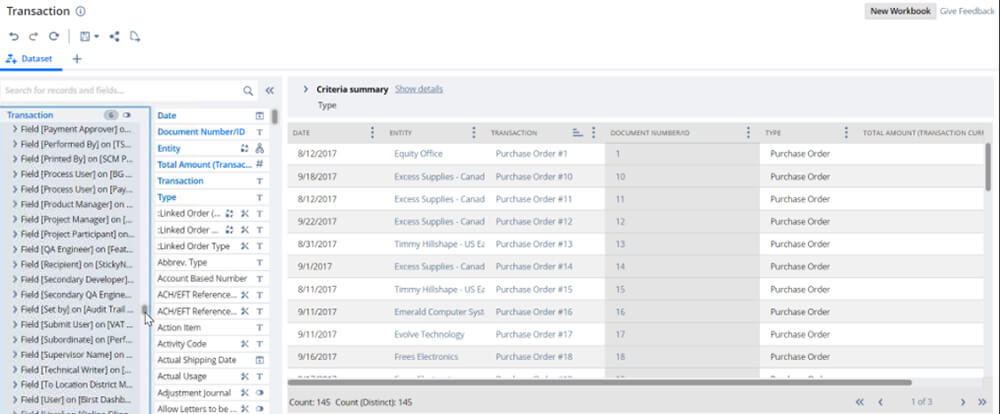
Prior to Workbook, users would commonly export data to Excel in order to filter and organize it. Using Workbook, users can query the database and pull it into an Excel-style spreadsheet interface within NetSuite, using drag-and-drop capabilities to manipulate the data. Users have access to any type of data in NetSuite, including any fields on any entity. There are default Workbooks that come with NetSuite that users can use as a template for their query or they can create a Workbook from scratch. Data fields can be added or deleted as necessary. When modifying the criteria, you will need to continually refresh the query to see updates.
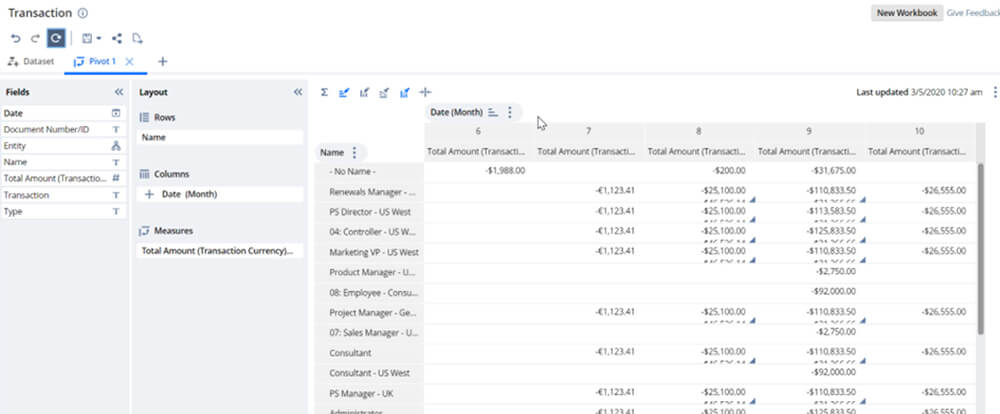
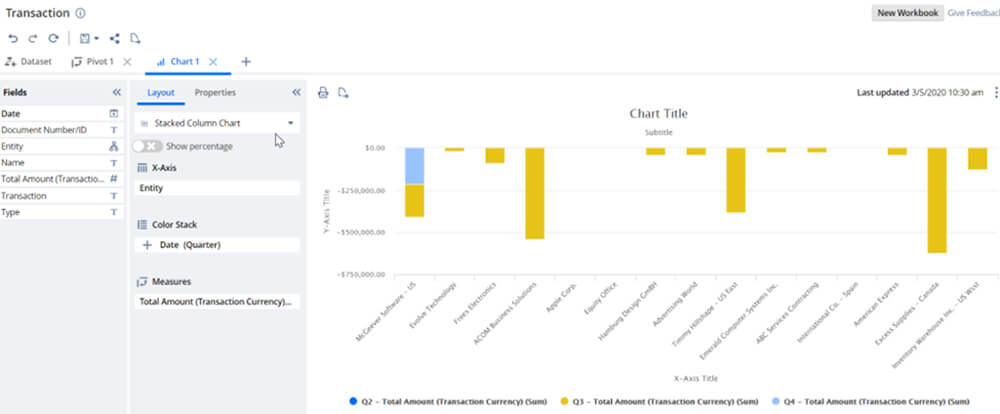
Once all of the criteria and filters in the query are added, users can create pivot tables or charts to visually represent that data. Fields can be easily dragged into the layout section to change the parameters of the table or chart. You can create as many pivot tables or charts as needed.
Explore NetSuite’s analytics capabilities with Rand Group
NetSuite’s SuiteAnalytics Workbook is a great tool for exploring data in an intuitive, user-friendly way. By creating data queries, pivot tables, and charts all in one tool, users can gain a better understanding of the details behind their data, regardless of their experience or knowledge levels. Rand Group is an experienced NetSuite partner that helps our clients get the most out of their software systems. For more information about using NetSuite SuiteAnalytics to gain better insights, contact a member of our Analytics team today.
NetSuite pricing guide
NetSuite offers a unique modular approach to subscription licensing for customers by providing licensing designed to provide the right value for your business. This includes modules that have competitive monthly prices for emerging (small) businesses, midmarket, and enterprise, and by industry such as wholesale distribution, manufacturing and retail, plus add-ons for expansion such as warehouse management.


