Tip of the Month
Sage Intacct Tip of the Month: Build custom dashboards that drive smarter decisions
Having accurate, real-time, at-a-glance visibility into your financials and operations is critical. Sage Intacct’s dashboard capabilities let you tailor the information your team sees, whether it’s an executive wanting cash balances, or a manager monitoring departmental metrics. But many users never tap into the full power of these custom dashboards. This tip of the month blog shows you how to create dashboards in Sage Intacct that deliver meaningful insight right on your home screen.
Tip: Build custom dashboards in Sage Intacct
You can easily build custom dashboards in Sage Intacct to display reports, KPIs, charts, performance cards, SmartLinks, and key operational data. You control the layout, filters, and user permissions so that each user or role sees what’s most relevant to them.
Set up:
Step 1: Open the Dashboards module
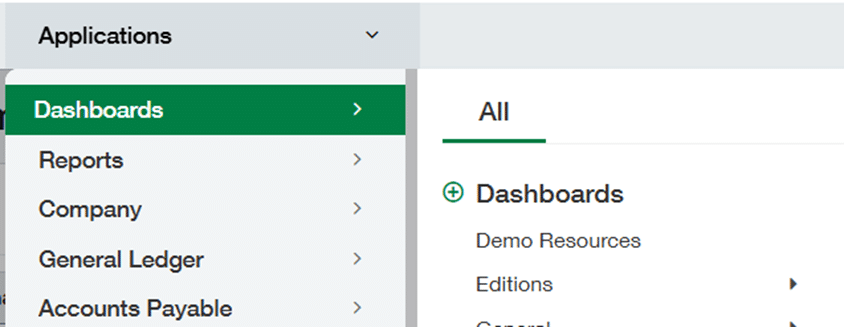
- In the navigation menu, go to Dashboards in Sage Intacct.
- Click on the + sign next to the Dashboards to create a new dashboard.
Step 2: Configure appearance
- Under the Appearance tab, enter a meaningful title and description for the dashboard.
- Choose how many columns the dashboard should display, set column widths, and optionally apply color groupings or themes.
Step 3: Define filters
- Click the Filters tab and select which data should be included or excluded for this dashboard.
- This lets you tailor the view, by department, location, entity, or dimension, so users see only what’s relevant to their role.
Step 4: Assign permissions
- Go to the Permissions tab and choose which users or user groups can view this dashboard.
- This ensures access control and personalization per role.
Step 5: Save the dashboard
- After filling in appearance, filters, and permissions, click Save to commit your settings.
- Return to the Dashboards home view and select View All to see your dashboards.
Step 6: Add components
- Open your newly created dashboard, then click the + button (or Add Components).
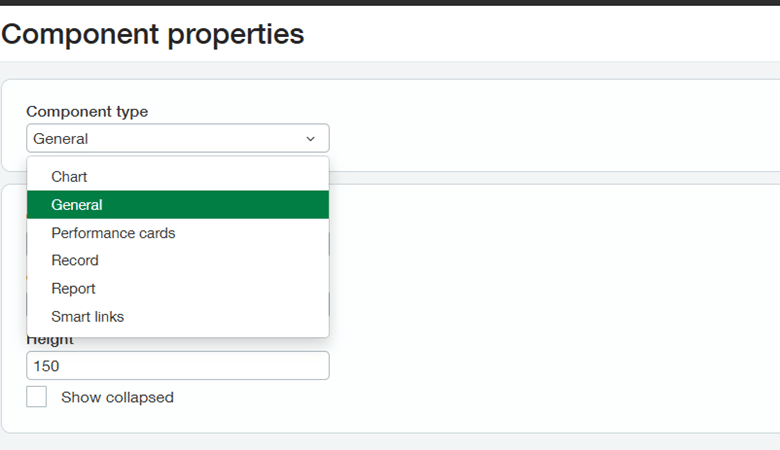
- In the Component Properties pane, choose from types such as Charts, Performance Cards, Reports, SmartLinks, General Information, Records, etc.
- Arrange the components to tell a visual story, like your AR aging, cash position, open orders, or staff performance metrics.
Step 7: Refine, test, and share
- Once the dashboard components are placed, preview the dashboard as the intended user(s).
- Adjust filters, layouts, or component settings as needed.
- Share or assign it officially so it becomes part of users’ home navigation.
Why this tip matters
Custom dashboards in Sage Intacct transform raw data into visual insight, empowering decision-makers to act faster and with confidence. Rather than sifting through multiple reports, your team can see what matters most. Whether that’s cash flow trends, departmental variances, operational KPIs, or high-level summary metrics your decision makers will have the data they need at their fingertips. Enabling dashboards tailored by role helps keep information relevant, reduces clutter, and boosts adoption of your financial system.
At Rand Group, we believe that knowledge is power, and practical tips like this unlock more value from your technology. If you’d like help designing dashboards suited to your business or assistance in rolling them out across your user base, we’re here to support you. Reach out today to connect with one of our Sage experts for help. And check back next month for yet another Sage Intacct Tip of the Month, as we continue to share actionable insights that help you make smarter business decisions.


