Dashboards and analytics for Microsoft ERPs — Jet Analytics, Power BI, or both?

As data volumes continue to increase, more and more businesses are graduating from reporting to analytics. Reporting gives organizations the ability to answer the question of “what happened”—such as last month’s sales or current inventory levels. Analytics goes a step further by helping teams understand “why something happened.”
To answer those deeper questions, businesses need to be able to analyze large volumes of data quickly and easily.
One of the simplest and most effective ways to do that is through data visualization. In fact, a team of neuroscientists from MIT found that the human brain can process entire images in as little as 13 milliseconds. This helps explain why dashboards and key performance indicators (KPIs) are often easier to interpret than rows of raw data.
Think about your own business—would it be easier to digest a financial statement with hundreds of rows, or see that same information presented through a few key metrics on a dashboard? In most cases, the dashboard tells the story much faster.
When it comes to analytics and dashboards in the Microsoft ERP space, two of the most common tools are Jet Analytics and Power BI. While they are often compared, they serve different purposes—and many organizations find value in using both.
Understanding the role of analytics in Microsoft ERP systems
Microsoft Dynamics ERPs such as Business Central and Finance & Operations provide strong transactional capabilities, but extracting meaningful insights requires dedicated reporting and analytics tools.
Modern analytics solutions help organizations:
- Consolidate data from multiple sources
- Improve reporting accuracy and speed
- Deliver timely insights
- Enable better decision-making across departments
Choosing the right approach depends on how your organization uses data—not just which tool you select.
Jet Analytics: Built for financial reporting and data modeling
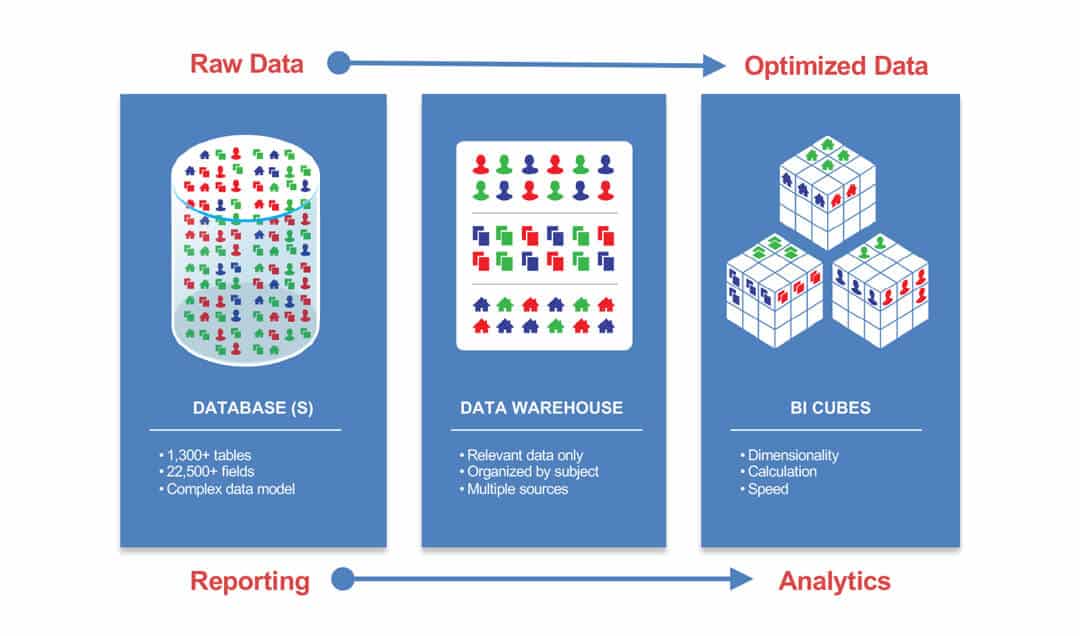
Jet Analytics is a reporting and business intelligence solution developed by insightsoftware and designed specifically for Microsoft Dynamics ERP systems. It is often used by finance and operations teams to create structured reports, manage data, and build a centralized source of truth for the organization.
Before dashboards can deliver meaningful insights, the underlying data needs to be structured, consistent, and reliable. That’s where Jet Analytics plays a critical role.
It provides:
- A data warehouse that consolidates ERP and external data
- Pre-built cubes and data models tailored to Dynamics
- Simplified reporting using familiar business terms
- Strong support for financial and operational reporting
Because Jet Analytics structures and organizes data before it is used, it allows organizations to generate consistent, accurate reports without requiring deep technical expertise.
This makes it particularly valuable for finance teams that rely on structured, repeatable reporting.
Power BI: Advanced visualization and dashboarding
Power BI is Microsoft’s business analytics tool that allows organizations to create interactive dashboards and visual reports. It is commonly used to present data in a way that is easy to understand and share across the business.
Once data is structured and reliable, organizations can focus on how it is presented and analyzed—and that’s where Power BI excels.
It enables organizations to:
- Create dynamic dashboards and reports
- Connect to a wide range of data sources
- Share insights across teams and stakeholders
- Perform advanced analytics using built-in tools
Power BI is particularly strong at helping users explore data visually and identify trends quickly. However, it is not designed to replace structured financial reporting tools, especially for organizations with complex accounting requirements.

Jet Analytics vs Power BI: Key differences
While both tools support reporting and analytics, they serve different purposes. Jet Analytics focuses on preparing and structuring data, while Power BI focuses on presenting that data visually..
Using Jet Analytics and Power BI together
Rather than choosing one tool over the other, many organizations use both to create a more complete analytics strategy.
Jet Analytics provides:
- Structured, governed data
- Pre-built financial reporting capabilities
- A centralized data warehouse
Power BI adds:
- Interactive dashboards
- Advanced visualizations
- Broader data connectivity
When used together, organizations can combine accurate financial reporting with dynamic, visual insights—creating a more complete view of business performance.
Real-world example: improving reporting speed and visibility with Jet and Power BI
A growing organization using Microsoft Dynamics 365 was struggling to keep up with reporting demands. Financial reports required significant manual effort, and leadership lacked timely visibility into performance across the business.
To address this, Rand Group implemented Jet Analytics to create a centralized data warehouse and standardized financial reporting. Power BI was then layered on top to deliver interactive dashboards for leadership and operational teams.
This combination reduced the time required to generate reports, improved data consistency, and gave stakeholders faster access to the insights they needed to make decisions.
When to use Jet Analytics
Jet Analytics is typically the better fit when:
- Financial reporting is a priority
- Data needs to be consolidated and standardized
- Users rely heavily on Excel-based reporting
- There is a need for a governed, consistent data model
When to use Power BI
Power BI is often the right choice when:
- Visual dashboards are a primary requirement
- Users need self-service analytics
- Data is coming from multiple systems
- Insights need to be shared broadly across the organization
When to use both
Using both tools together is often the best approach when:
- Financial reporting and dashboards are both critical
- Data complexity requires structured modeling
- Multiple teams need different types of insights
- The organization is scaling its analytics capabilities
Many organizations find that combining the two provides a more flexible and scalable solution than relying on a single tool.

Build a reporting strategy that fits your business
Choosing the right analytics tools is only part of the equation. To get real value, your reporting strategy needs to align with your ERP, your data, and how your teams make decisions. Rand Group helps organizations evaluate their reporting needs, implement Jet Analytics and Power BI, and design scalable analytics frameworks that deliver meaningful insights.
Choosing the right approach for your organization
There is no one-size-fits-all answer. The right solution depends on:
- Your reporting requirements
- The complexity of your data
- The technical skillset of your team
- Your long-term analytics strategy
Organizations that take the time to align their tools with their business processes are more likely to see long-term success from their analytics investments.
How Rand Group helps
At Rand Group, we help organizations design and implement analytics strategies that align with their business processes and reporting needs.
Our team works with clients to:
- Evaluate reporting and analytics requirements
- Implement Jet Analytics and Power BI solutions
- Design data models and dashboards
- Ensure data accuracy and governance
Learn more about our approach to analytics in our reporting and analytics services.
Frequently asked questions about Jet Analytics and Power BI
What is the difference between Jet Analytics and Power BI?
Jet Analytics focuses on data preparation, consolidation, and structured financial reporting, while Power BI is designed for visualization and interactive dashboards.
Can Jet Analytics and Power BI be used together?
Yes. Many organizations use both tools together. Jet provides a centralized data model, while Power BI delivers dashboards and visual insights built on that data.
Is Power BI enough for financial reporting?
Power BI is strong for dashboards and analytics, but it is not designed for traditional financial statements. Many organizations use Jet alongside Power BI to meet those needs.
Do I need a data warehouse for Power BI?
Not always, but a data warehouse improves data consistency and performance. Jet Analytics provides a structured data foundation that makes Power BI more effective.
When should I use Jet Analytics instead of Power BI?
Jet Analytics is typically the better choice when your organization needs structured financial reporting and consistent, governed data models.
How do I choose the right analytics solution for my ERP?
The right approach depends on your reporting needs, data complexity, and business goals. Many organizations benefit from combining tools rather than choosing just one.
Next steps
Choosing between Jet Analytics, Power BI, or both is not just a technology decision—it’s a strategic one.
If your organization is struggling with reporting limitations, data visibility, or disconnected systems, the next step is to evaluate your current analytics approach and identify where improvements can be made.
Our team works with organizations to align reporting tools with business processes, ensuring that data is accurate, accessible, and actionable.
If you’re ready to take the next step, contact us to learn how Rand Group can help you build a reporting and analytics strategy that supports better decision-making and long-term growth.