Chart of accounts structure: Best practices for better reporting and scalable growth

A well-designed chart of accounts (COA) is more than an accounting requirement; it’s the foundation of financial reporting, budgeting, forecasting, and business visibility. However, many organizations outgrow their original COA as reporting needs evolve and business complexity increases.
As companies add new entities, departments, products, or locations, an outdated chart of accounts can lead to inconsistent reporting, excessive spreadsheet manipulation, and limited scalability. Without a thoughtful chart of accounts structure, finance teams often struggle to deliver timely, meaningful insights.
Fortunately, modern ERP systems and chart of accounts best practices make it possible to simplify financial management while improving reporting flexibility. In this guide, we’ll explore common chart of accounts challenges, proven structuring strategies, and how modern ERP platforms can support long-term growth.
What is a chart of accounts?
A chart of accounts is the framework used to organize an organization’s financial transactions within the general ledger. The structure and numbering convention of accounts directly impact how easily finance teams can report on performance, analyze trends, and support decision-making.
Most organizations organize accounts using a numbering hierarchy such as:
Examples include:
- 1010 Cash Operating Account
- 1150 Accounts Receivable
- 2010 Accounts Payable
- 4010 Product Revenue
- 5010 Direct Materials
- 6100 Salaries Expense
A logical chart of accounts structure allows finance teams to quickly identify account types, group related transactions, and create meaningful financial reports. More importantly, it provides a scalable foundation for future reporting and growth.

Need help restructuring your chart of accounts?
A cleaner chart of accounts can improve reporting, simplify financial processes, and create a stronger foundation for growth. Our ERP and finance experts can help you assess your current structure, identify opportunities for improvement, and design a scalable COA that supports your reporting needs today and into the future. Reach out today to start modernizing your chart of accounts.
Common chart of accounts structure problems
Many organizations inherit a chart of accounts that evolved organically over years of growth. While it may have worked initially, the structure often becomes a barrier to effective reporting.
The chart of accounts has become too large
One of the most common issues is account proliferation.
Finance teams frequently create new accounts to satisfy reporting requests, resulting in separate accounts for:
- Departments
- Locations
- Projects
- Products
- Business units
Over time, the chart becomes difficult to maintain and navigate.
Common consequences include:
- User confusion
- Increased maintenance effort
- Inconsistent account usage
- Slower month-end close processes
No logical numbering structure
Organizations that add accounts reactively often lose consistency in account numbering.
Without a logical hierarchy:
- Similar transactions may be recorded in unrelated accounts.
- Financial statement groupings become inconsistent.
- Trend analysis becomes more difficult.
A well-organized numbering structure should support both accounting requirements and management reporting needs.
No room for growth
Many charts of accounts are designed without considering future expansion.
For example:
Poor structure
- 6100 Salaries
- 6101 Payroll Taxes
- 6102 Benefits
Scalable structure
- 6100 Salaries
- 6150 Payroll Taxes
- 6200 Benefits
Leaving gaps between account numbers provides flexibility to add accounts later without disrupting reporting structures.
Trying to track everything through account numbers
Some organizations attempt to encode every reporting dimension into the account number itself.
Examples might look like:
- 61501234-Marketing-Texas-West-Online
While this approach may seem logical initially, it often creates:
- Bloated charts of accounts
- Difficult maintenance
- Limited reporting flexibility
- Increased user error
The chart of accounts was designed for the past
Many finance teams find that their chart of accounts no longer reflects the realities of the business.
Growth creates new requirements such as:
- Multi-entity reporting
- New product lines
- Geographic expansion
- Acquisitions and mergers
A chart of accounts designed for a small organization may struggle to support a larger, more complex business.
Chart of accounts structuring best practices
The most effective chart of accounts structures balance simplicity, reporting flexibility, and scalability.
Design for reporting first
Before creating accounts, finance leaders should ask:
“What information does management need to make decisions?”
The chart of accounts should support reporting around:
- Revenue streams
- Cost categories
- Expense functions
- Profitability analysis
The goal is to create meaningful reporting groups rather than simply organizing transactions.
Create a logical numbering hierarchy
Consistent numbering helps users understand account relationships and improves reporting clarity.
For example:
Revenue
- 4000 Product Revenue
- 4100 Service Revenue
- 4200 Subscription Revenue
Operating Expenses
- 6100 Payroll
- 6200 Marketing
- 6300 Technology
- 6400 Occupancy
This structure creates natural reporting categories while supporting future growth.
Leave room for expansion
One of the simplest but most valuable chart of accounts best practices is leaving intentional gaps in numbering sequences.
Benefits include:
- Easier maintenance
- Greater flexibility
- Reduced need for renumbering
- Improved scalability
Organizations rarely regret leaving room for growth, but many regret not doing so.
Choose the right account number length
The number of digits in a chart of accounts should reflect the organization’s reporting needs, complexity, and growth plans. A 4-digit structure may work well for smaller businesses with straightforward reporting requirements, while 5-digit or 6-digit structures can provide more room for account groupings and future expansion.
However, longer account numbers are not automatically better. If departments, locations, projects, entities, or products are built into the account number, the chart of accounts can quickly become difficult to maintain. In modern ERP systems, those details are often better handled through dimensions, segments, classes, departments, locations, or projects.
For many growing organizations, a 5-digit structure provides a practical balance between flexibility and usability. The goal is to create enough room for growth without adding unnecessary complexity.
This fits the best-practices format and bridges nicely into the later point about keeping accounts focused on transaction type.
Keep accounts focused on transaction type
General ledger accounts should answer one primary question:
What type of transaction occurred?
Accounts should be used to track:
- Assets
- Liabilities
- Revenue
- Expenses
They should generally not be used to track:
- Departments
- Projects
- Locations
- Products
- Cost centers
Modern ERP systems provide better tools for managing those reporting dimensions.
Balance detail with simplicity
Too few accounts can limit visibility. Too many accounts create complexity.
A useful rule of thumb is:
If leadership will not regularly use the information to make decisions, it may not warrant a separate account.
Organizations should carefully evaluate whether a reporting requirement is best addressed through a new account or through modern reporting dimensions.
How modern ERP systems simplify chart of accounts management
Historically, many accounting systems required organizations to create increasingly complex account structures to achieve detailed reporting. Modern ERP systems have changed that approach by allowing finance teams to capture reporting detail outside of the general ledger account number.
Rather than expanding the chart of accounts for every department, location, project, or entity, organizations can use dimensions, segments, classes, departments, locations, and analytical reporting structures. This provides deeper visibility while maintaining a cleaner general ledger. This allows the chart of accounts to stay focused on transaction type while the ERP system handles the additional reporting context.
This modern approach can help organizations:
- Reduce account sprawl and duplicate accounts
- Improve reporting consistency across departments or entities
- Support multi-entity and multi-location growth
- Analyze performance by project, department, customer, or location
- Reduce reliance on manual spreadsheet reporting
- Maintain a more scalable financial structure over time
ERP solutions such as Sage Intacct, Microsoft Dynamics 365 Business Central, Dynamics 365 Finance & Operations, and NetSuite all offer tools that support more flexible financial reporting and cleaner chart of accounts structuring. For example, Sage Intacct supports dimensional accounting, Business Central offers dimensions and analysis views, and NetSuite provides segments such as classes, departments, locations, and subsidiaries. While the terminology varies by platform, the objective is the same: provide detailed reporting without creating unnecessary general ledger account complexity.
We’ve helped organizations apply this strategy in real-world ERP projects. For Henry Resources, a family office managing oil and gas interests and other investment activity, Rand Group helped implement NetSuite and consolidate financial data from QuickBooks, Wolfepak, Excalibur, SQL Server reporting, and spreadsheets into one unified ERP platform. As part of the project, Henry Resources unified 30–40 separate charts of accounts into a single chart of accounts, enabling faster consolidation, stronger controls, automated elimination entries, and clearer visibility across entities, investments, and well-level reporting.
For B-29 Investments, our team helped deploy a shared dimensional chart of accounts across more than 20 entities in Sage Intacct, improving reporting visibility while reducing account complexity. Their users can now easily toggle between entities and view consolidated payables and receivables at a glance. For Sapphire Gas Solutions, our Business Central experts helped refine financial structures during implementation, creating stronger visibility and more centralized financial management.
For growing organizations, the value of modern ERP is not simply having more reporting options. It is the ability to design a chart of accounts structure that is simpler, more flexible, and better aligned with long-term business growth.
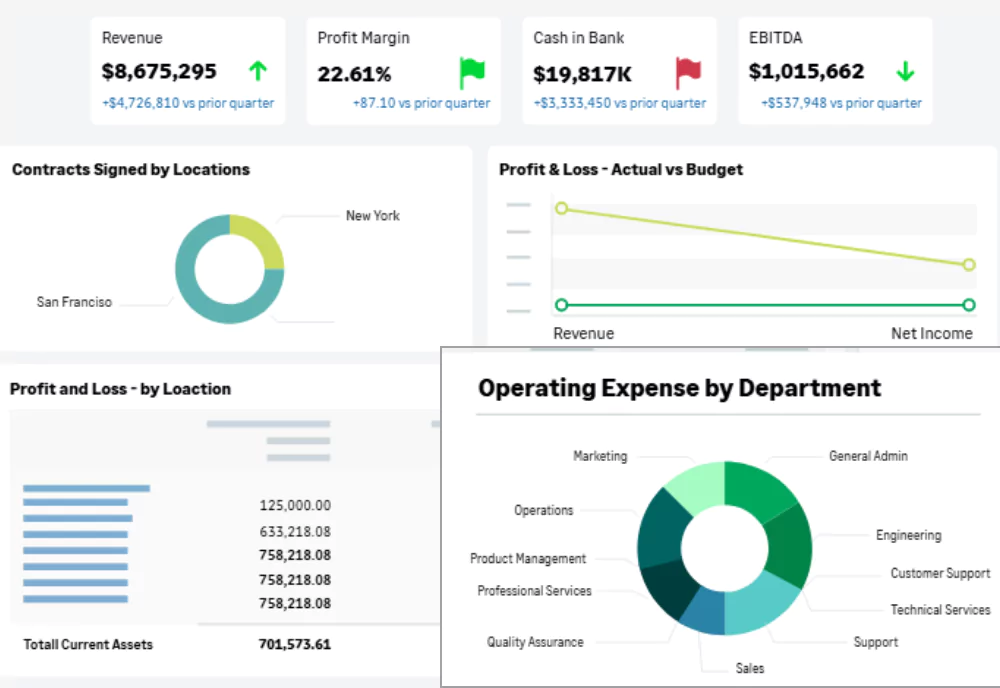

Choose the right ERP for your financial structure
Not sure which ERP solution best supports your chart of accounts, reporting needs, and long-term growth plans? Our software selection experts can help you evaluate your options, compare requirements, and choose a financial management platform that aligns with your business goals.
The common ERP advantage
Regardless of the solution you adopt, modern ERP platforms provide similar advantages:
- Reduced chart of accounts complexity
- Improved reporting flexibility
- Better multi-entity visibility
- Faster financial reporting
- Less spreadsheet dependency
- Greater scalability
The objective is no longer to create more accounts. The objective is to create better reporting.
Signs it’s time to redesign your chart of accounts
Organizations should consider evaluating their chart of accounts structure if they experience any of the following:
- Financial reports require extensive Excel manipulation
- Users frequently request new general ledger accounts
- Reporting varies significantly across departments
- Month-end close cycles are growing longer
- The business has experienced significant growth
- An ERP migration is being planned
- Multi-entity reporting has become difficult
These symptoms often indicate that the chart of accounts is no longer aligned with reporting requirements.
How Rand Group helps organizations modernize their chart of accounts structure
Modernizing a chart of accounts requires more than renumbering accounts. It means aligning financial structures with reporting goals, operational processes, and long-term growth plans.
For more than two decades, Rand Group has helped organizations improve finance operations through ERP consulting, implementation, optimization, and business process improvement. Services include:
- Chart of accounts assessment and optimization including current-state analysis, account rationalization, and future-state design
- ERP implementation and modernization to support scalable financial management, streamlined processes, and improved reporting visibility
- Reporting and dimension strategy for departments, cost centers, projects, locations, and multi-entity reporting
- Data migration and COA redesign including legacy account cleanup, account consolidation, and reporting modernization
By combining accounting expertise with deep ERP implementation experience, our experts help organizations build chart of accounts structures that support today’s reporting needs and tomorrow’s growth.
Chart of accounts structure: Frequently asked questions
What is the best chart of accounts structure?
The best chart of accounts structure organizes accounts by financial statement category, supports reporting requirements, leaves room for growth, and avoids unnecessary complexity.
How should chart of accounts numbers be organized?
Most organizations use account ranges such as 1000–1999 for assets, 2000–2999 for liabilities, 3000–3999 for equity, 4000–4999 for revenue, 5000-5999 for cost of goods sold, and 6000–7999 for operating expenses.
Should a chart of accounts use 4, 5, or 6 digits?
It depends on the organization’s size, reporting needs, and ERP system. Four-digit account numbers may work for smaller businesses, while five- or six-digit structures provide more room for growth. However, departments, locations, projects, and entities are often better tracked through ERP dimensions or segments rather than longer account numbers.
What are common chart of accounts mistakes?
Common mistakes include creating too many accounts, embedding departments or locations into account numbers, using inconsistent numbering conventions, and designing only for current reporting needs.
How do modern ERP systems improve chart of accounts management?
Modern ERP systems use dimensions, departments, locations, projects, and reporting segments to provide detailed insights without requiring additional general ledger accounts.
When should a company redesign its chart of accounts?
Organizations should evaluate their chart of accounts when reporting becomes difficult, growth introduces complexity, ERP migrations are planned, or leadership requires greater financial visibility.
What is dimensional accounting?
Dimensional accounting allows organizations to track departments, locations, projects, customers, and other reporting attributes separately from the general ledger account structure, creating cleaner financial reporting and greater flexibility.
Build a chart of accounts structure that supports growth
A chart of accounts should simplify reporting, not create additional challenges. The most effective chart of accounts structuring strategies use logical numbering, reporting-driven design, and enough flexibility to support future growth.
As reporting needs become more complex, modern ERP systems can help organizations maintain a cleaner chart of accounts while gaining deeper financial visibility. By proactively evaluating and modernizing your COA, you can create a financial reporting structure that can adapt as the business grows. Contact us today to learn how our ERP and finance experts can help you optimize your COA structure, improve reporting, and build a financial framework that supports long-term growth.