Gain powerful insights into your Microsoft Dynamics 365 data with data visualization tools
Your business generates more and more data each day and raw data may be difficult to sift through to find useful insights. Data visualization tools will help your organization turn raw data from Microsoft and other sources into easily understood and visually compelling business information. Rand Group data analysts will help evaluate your processes and implement a data visualization solution that will steer performance and data analysis across your organization.

Make intuitive sense of your data through stunning visualizations
Data is one of the most important assets of any organization and hidden within your data lies important insights that can help drive business performance. Unfortunately, many companies struggle to spot trends in data and do not have the tools to demonstrate performance and understand the impact of business strategies. Enterprise resource planning (ERP) solutions are designed to collect data but it is difficult for a business user to access the data and format it in a consumable way without help from IT. Reading financial reports with the same layout of raw data in rows and columns can be difficult to interpret.
Being able to see the story within the data is crucial for every business’s success. Through data dashboards, interactive reports, charts, graphs, and other visual representations, you can see the big picture and make data-backed decisions. The use of smart data visualization tools can help lead to strong business results. Empower your business users to take data into their own hands with a robust business intelligence solution.

Empower business users and increase productivity
An intelligent data visualization solution designed specifically for business users makes it easy to turn data into insightful charts and dashboards using drag and drop functionality. Drill-down capabilities and collaborative features help the entire organization stay on the same page with a single version of the truth.

Leverage visualizations and drive deeper insights
With robust data visualization tools, users can create charts, apply filters, and drill down to find answers and gain perspective on important data. Interactive dashboards can make it easy to spot patterns and make connections leading to better decision-making and organizational performance.

Analyze trends and plan for the future
Once business users have accurate and relevant information available on-demand it is easier to monitor the health of an organization and make any necessary adjustments. Detect trends by comparing data across years of history and take proactive corrective measures to ensure your organization’s success.
eBook
Transform data into a more colorful picture of your business
With the right data visualization tools at your fingertips, you can find key insights in real-time and share them across your organization. Download this eBook to discover your data spectrum and learn how to illustrate data to make informed data-driven decisions.

eBook
Transform data into a more colorful picture of your business
With the right data visualization tools at your fingertips, you can find key insights in real-time and share them across your organization. Download this eBook to discover your data spectrum and learn how to illustrate your data to make informed data-driven decisions.
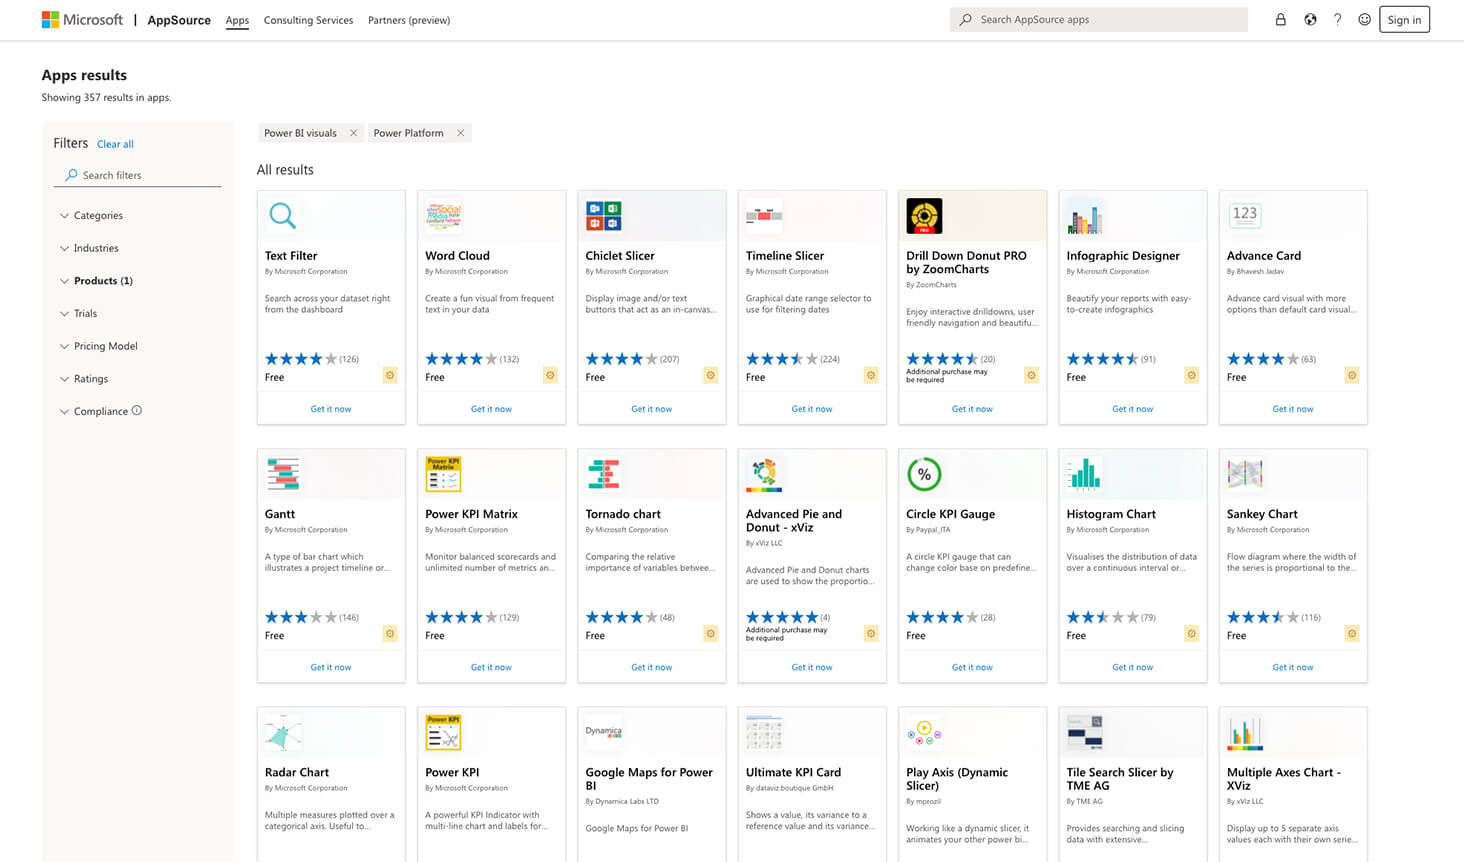
Unlock hundreds of different visuals
Data visualization tools are a powerful way to tell your data story and discover valuable insights that can help drive your business forward. Business users can create charts, graphs, or other visual representations to bring data to life. Visuals can be shared with the entire organization and users can drill down to see what data is being used.
Business users will have the ability to create their own custom visuals or utilize existing visuals including:
- Area charts
- Bar and column charts
- Decomposition trees
- KPIs
- Line charts
- Maps
- Matrices
- Pie Charts
Combine your visuals into powerful dashboards
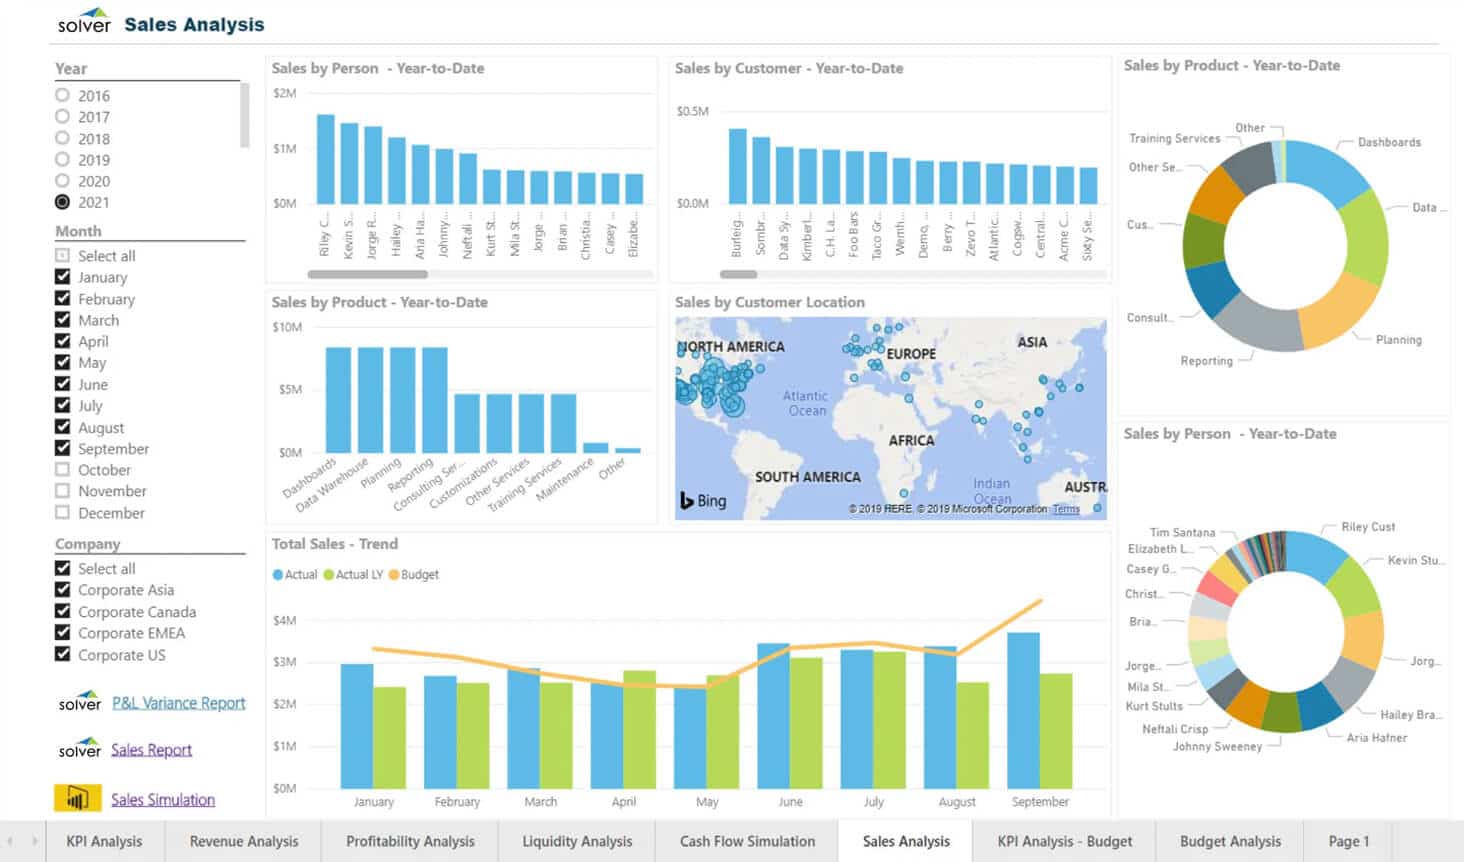
Data dashboards are a single pane tool used to organize and display important information at a glance allowing business users to understand the company’s most valuable data to address critical questions. A dashboard typically includes multiple visualization tools, such as tables, charts, and graphs. Business users can create custom dashboards with specific KPIs to see the wellbeing of the company and measure performance. Dashboards improve data transparency and accessibility, increase agility, and forecasing
Dashboards can cover the entire organization, specific departments, or processes such as:
- Sales dashboard
- Marketing dashboard
- Employee dashboard
- Financial dashboard
Choose the best data visualization solution suited to your unique needs
At Rand Group we focus on your business needs first and the technology solution to meet those needs second. We offer a wide variety of data visualization solutions such as Power BI, Jet Reports/Analytics, and Solver that enable you to create powerful visualizations from your Microsoft data to see important insights.
Power BI
Microsoft Power BI is the gold standard of data visualization software and an important piece of an overall business intelligence strategy. Allow your business users to make intuitive sense of their data with charts, graphs, and personalized dashboards.
Jet Analytics
Jet Dashboard Builder is a part of Jet Analytics that allows users to build dashboards in minutes with simple drag and drop capability. The cubes, measures, and dimensions created in Jet Analytics empower users to quickly create the dashboards they need.
Solver
With Solver you get the tools you need to have complete access to your data enabling you to have stunning visualizations and robust dashboards available at your fingertips to make smarter decisions.


