How to display Power BI data using workspaces in Dynamics 365 Finance and Operations

Do you spend a significant amount of time navigating from software to software and page to page in an attempt to find the data that you need? Trying to find and compile the information you need to work with can often be a task in and of itself. Workspaces are a feature of Dynamics 365 Finance and Operations that organize information related to work items in a way that is designed to increase the efficiency of a user’s daily tasks. Workspaces can surface a wide variety of data, including rich visuals from Power BI. In this post, we will explain what workspaces are and how you can use workspaces to display Power BI data.
What are Workspaces and why do they matter?
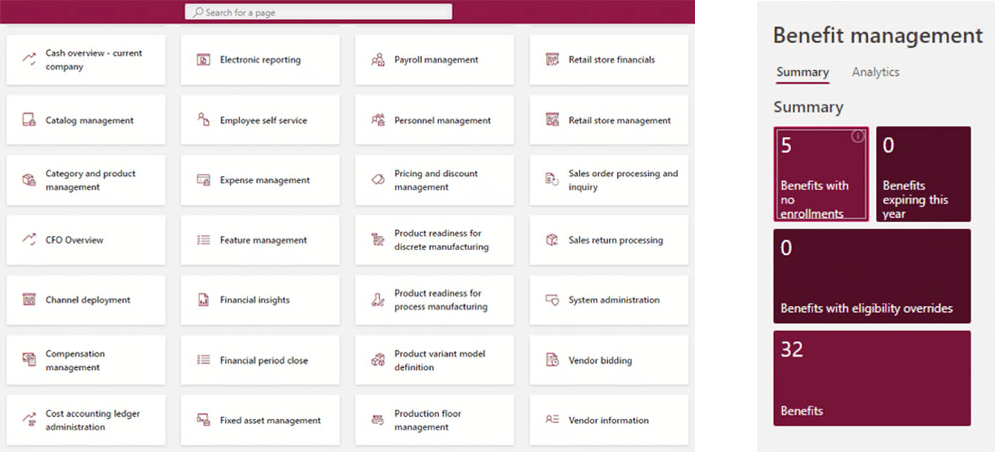
Workspaces are a collection of tasks, links, and visualizations related to a specific work item or role within Dynamics 365 Finance and Operations.
Workspaces enable a user’s work environment to be easier to work with, as a user can spend less time navigating between windows and pages and instead, complete all necessary tasks within one landing page. The information is designed to be organized in an intuitive, user-friendly manner that facilitates greater efficiency and understanding.
There are many out-of-the-box workspaces that come with Finance and Operations such as Expense Management, Invoicing, and Payroll Management. These standard workspaces can be modified and extended to meet your exact needs. There is also the capability of creating a new workspace from scratch if you find that modifying a standard workspace is not suiting you.
Each workspace contains tiles, links, and lists. Tiles are areas that contain high-level information and work like a link if clicked. They are organized on the left side of the page within a workspace. You have the option to show count metrics on tiles, and they can be pinned to your dashboard to enable you to quickly see important data at a glance.
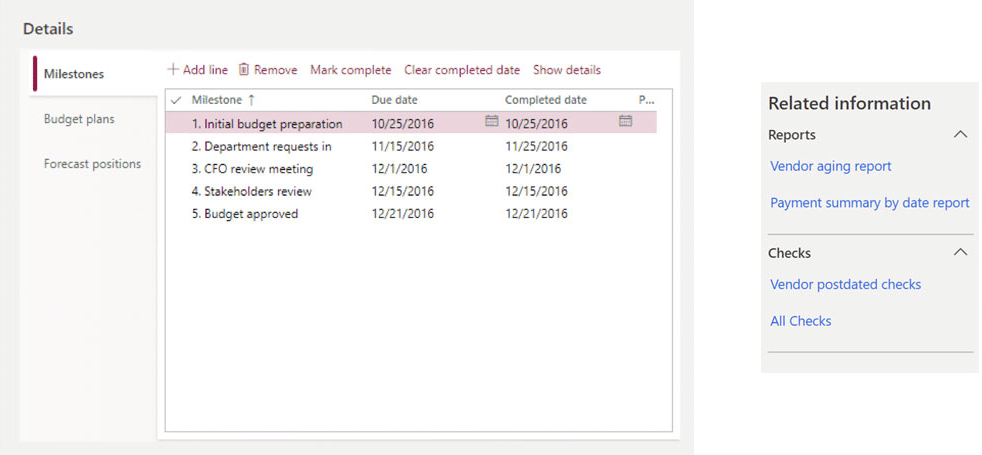
Lists are areas of a workspace that contain pre-defined information that is designed to be helpful in some way. Each workspace contains different lists depending on the nature of the work item. They are displayed in the middle of the page, and each list can contain a maximum of eight columns. A user has the ability to reorder or rename any of the fields or tabs.
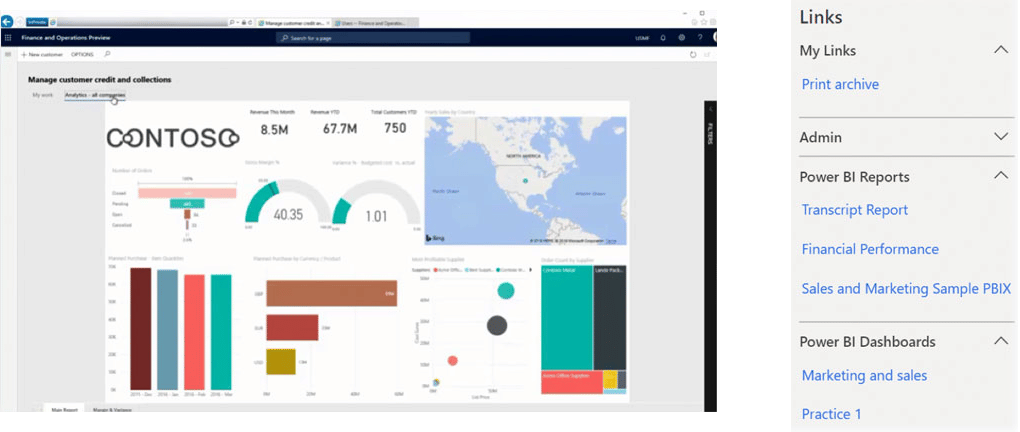
Links are contained in the far-right panel of a workspace, and they provide access to important pages that are organized into sections based on their purpose. The groups are able to be reordered and renamed, as well as the ability to collapse or expand the grouping.
Using a process called Personalization, users are able to create their own workspaces or workspace components. Any customizations made are specific to the user only, but workspaces can be shared among users. A user with an admin role can apply a personalization to a group of users without them needing to request it or do any importing.
How to use Workspaces to surface Power BI data
Power BI is an add-on business intelligence solution that collects data from a variety of sources and turns it into charts, graphs, and reports that can be embedded within Finance and Operations. The advantage of including Power BI reports within workspaces is that you can quickly get a snapshot of what’s going on in your business. You need only to log in to a single system in order to gain access to relevant analytical information, and you can easily flip from reports to transactions all in one screen.
Power BI must first be integrated into your Finance and Operations environment through the Azure Directory. Once integrated, you have access to Power BI tiles, links, and reports for use in your workspaces.
By incorporating a Power BI tile into your workspace, you can open a report by clicking the tile and interact with the report through drill-down capabilities and filters. By clicking on the charts and graphs, users can see cause and effect capabilities and perform what-if operations, all without leaving the workspace. These functions allow users to generate forecasts and prepare for future demands.
Power BI links contain a Report group and Dashboard group. The Report group contains links to various reports that can span multiple pages and enable a user to drill, filter, and slice the data to gain relevant insights. The Dashboard group consists of only one page and includes hover details.
Workspaces are collections of tiles, links, and visualizations related to a user role that contains all the relevant information designed to assist users with performing their daily tasks. Included in the wide variety of available workspace data are Power BI reports. With less time spent navigating between pages and separate data sources, workspaces can empower your users to achieve greater efficiency, enhance their understanding of what’s going on in your business, and drive relevant decision-making. If you’re interested in getting started with workspaces and Power BI, contact Rand Group today. We are a Microsoft Gold partner with over 17 years of experience assisting clients in achieving their business goals through technology.
Modernize your data strategy
Business Intelligence is a necessary investment to gain insight into your data. Yet a surprising number of organizations are still utilizing yesterday’s tools to try to solve the problems of tomorrow. We have compiled the lowest cost, highest return methods to add immediate value to your analytics and reporting investments in our 5 Tips for Modernizing Your Data Strategy white paper.


