Power BI capabilities
Power BI is a collection of software services, apps, and connectors that work together to turn your unrelated sources of data into coherent, visually immersive, and interactive insights. With Power BI capabilities, data is available in real time, which helps lead to better decisions and better business.

Intuitive and flexible, Power BI lets you connect, analyze and share data across your organization
Connect Data
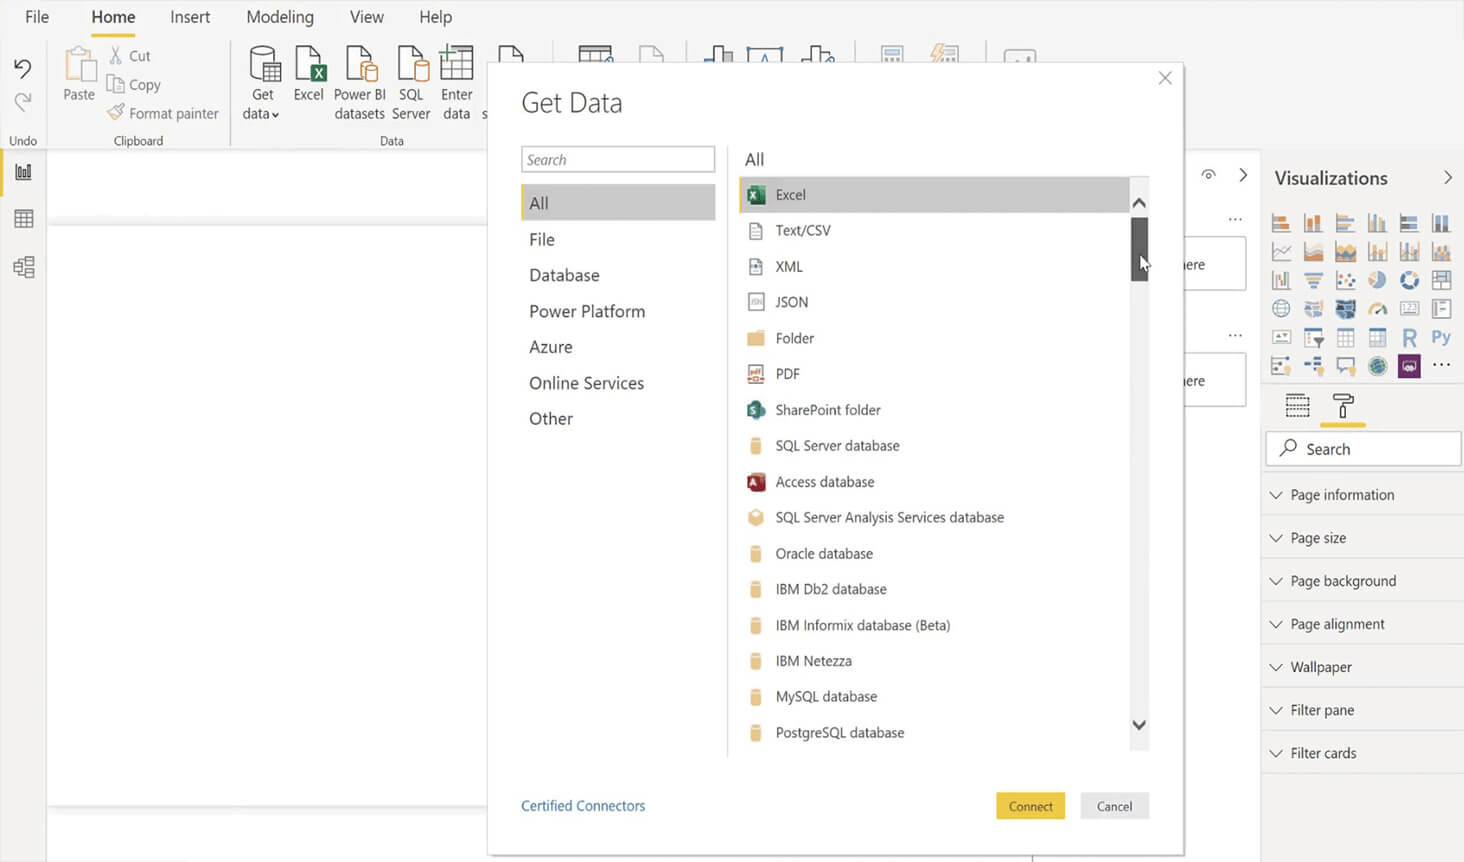
Microsoft offers over 120 free connectors for Power BI that allow you to connect directly to your data source or sources, including on-premise and cloud data sources such as Dynamics 365, Azure SQL Database, Salesforce, Google Analytics, Excel, and SharePoint, and many more.
Create Data Models
With the Power BI Power Query Editor, clean and transform your data by renaming columns or tables in bulk, change text to numbers, and more. Combine data from a number of data sources and shape as needed to consolidate them into a single, useful query. Use queries to pull data for visualizations.
Dashboards and Reports
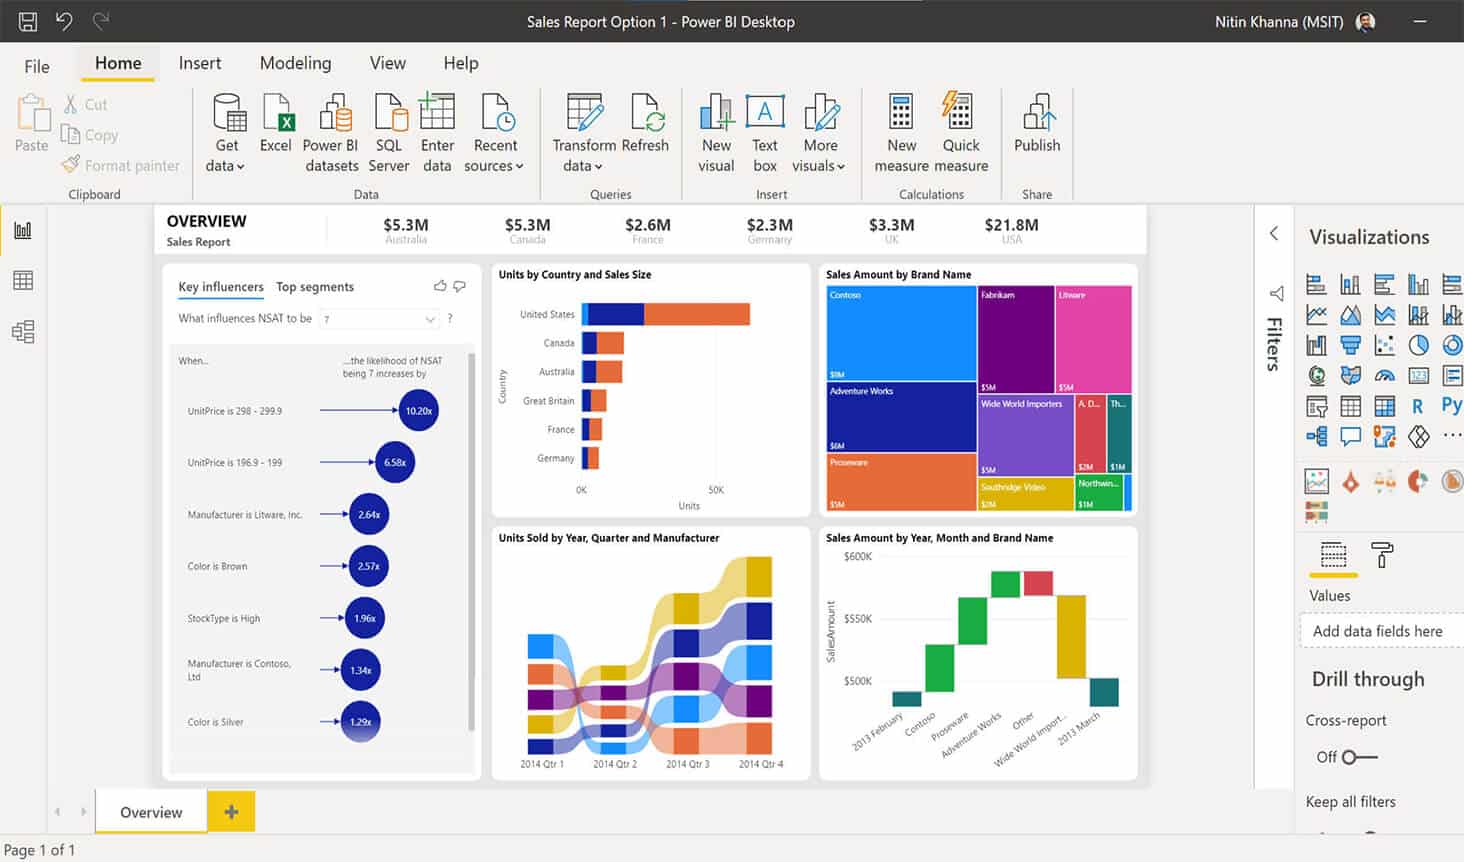
Monitor your business and see all of your most important metrics at a glance with dashboards. Combine on-premises and cloud data, providing a consolidated view regardless of where the data lives. Choose from numerous visualizations to build reports based on multiple datasets.
Share and Collaborate
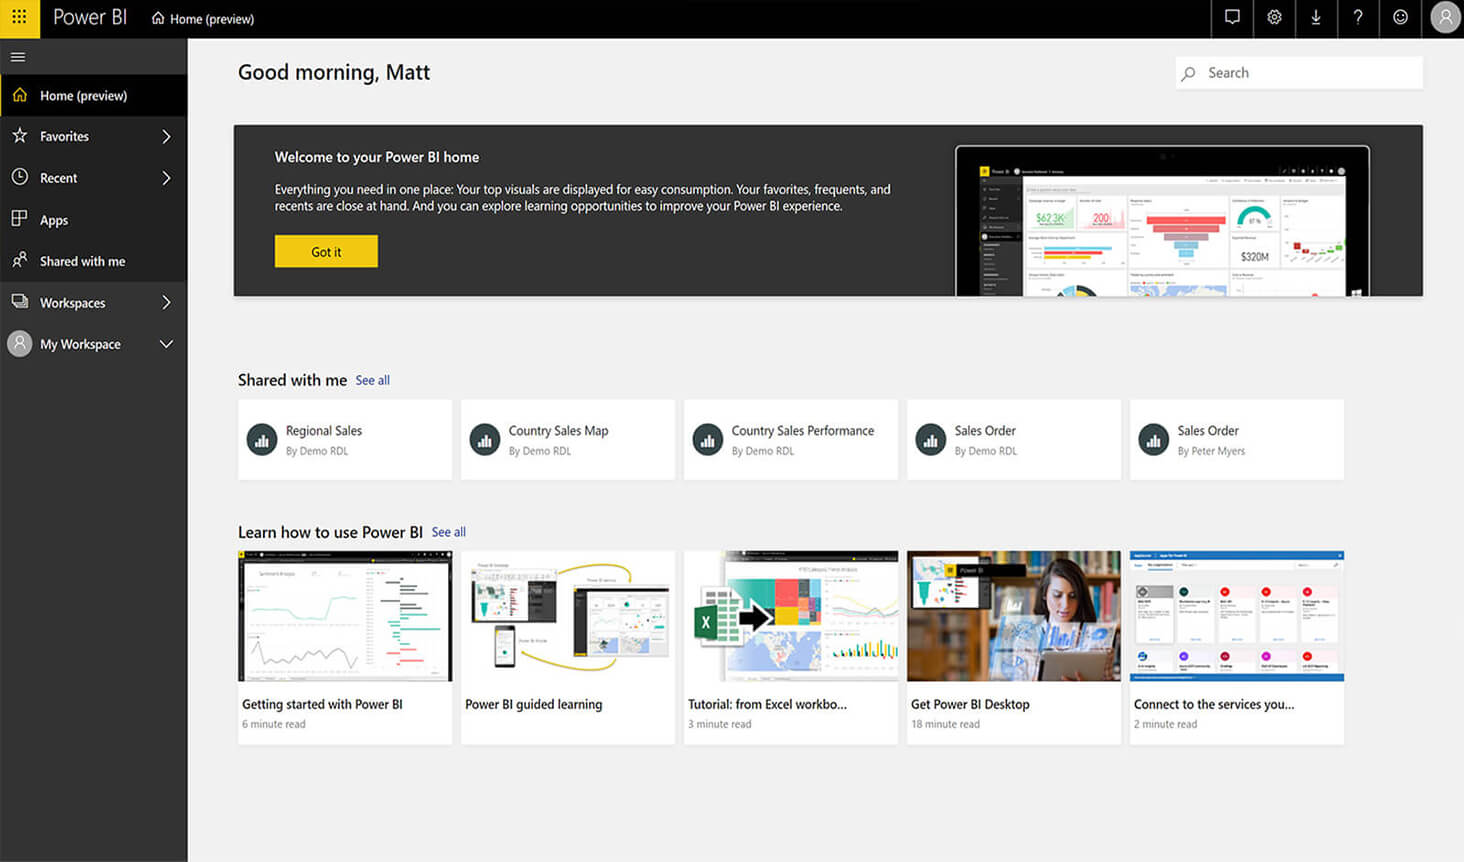
Collaborate with other Power BI users with Workspace or chat with team members in Microsoft Teams by directly embedding a visualization in a chat. Choose who you share your dashboards with or publish to live for embedding on a website. Publish a dataset or save to a static PDF.
Get co-funding from Microsoft to explore Power BI
Explore the transformative power of Power BI with a dashboard-in-a-day workshop or a 3-week personalized pilot to help you visualize your future state solution. Work with our team of data analysts and business consultants to identify high value initiatives to deliver business success.
Learn Power BI with dashboard-in-a-day
In this one-day, hyper-focused workshop, Rand Group data analysts will guide you through building a dashboard in Power BI that will help deliver actionable insights for your business. Attendees will build knowledge on how to leverage Power BI to better analyze data and build visualizations for others to understand.
3-week pilot to visualize and evaluate Power BI
Visualize how Power BI can optimize your reporting with a 3-week personalized pilot. Rand Group will run a live simulation using your data to demonstrate to key stakeholders how Power BI can help transform your business.
Choose from hundreds of visualizations to display your data
Start visualizing your data in seconds with an extensive library of data visualizations in Power BI or browse hundreds more in AppSource. Each visual has been tested and approved by Microsoft to integrate seamlessly with Power BI and provide valuable insights.
Out-of-the-box visualization types include:
- Area, bar, column, and combo charts
- Cards, decomposition trees, funnel and gauge charts, maps, and KPI charts
- Q&A visual, R script visuals, ribbon charts, scatter plots, tables, and treemaps
- Waterfall charts, Power Apps visuals, smart narratives, slicers, standalone images, and more
Create one cohesive view of your business data
Use data sources to connect to hundreds of sources of data then import into Power BI to create a single, unified view of your business data.
Connect your Microsoft sources such as Excel and SharePoint, plus third party sources including Salesforce and Google Analytics. Other examples of sources that can be integrated into Power BI include:
- Azure, Dataverse, Dynamics 365 applications, such as Business Central and Finance, plus Dynamics NAV
- Google BigQuery, IBM DB2, MailChimp, Marketo, Oracle, QuickBooks
- SAP, Snowflake, SQL servers, Survey Monkey
- PDFs, text files, SVG, Twilio, Workforce dimensions
Share dashboards and collaborate with team members
Distribute and share your dashboards, reports, datasets, and more to the Power BI Service for collaboration with team members. With the Power BI tab for Microsoft Teams, you can embed interactive reports directly in a chat.
Examples of Power BI integrations across the Microsoft universe:
- Export and email reports automatically using Power Apps
- Browse the library of Power BI templates, or create your own, then import it into your Dynamics 365 app.
- View Dynamics 365 Business Central data in Power BI, and vice versa
- Import datasets into Excel then view and interact with them using PivotTables


