Dynamics 365
 Power Platform
 Dynamics
Connect Power BI to Dynamics 365 Finance and Operations for advanced ERP analytics

Dynamics 365 Finance & Operations manages your core financial and operational processes. However, turning transactional ERP data into clear KPIs, trend analysis, and executive dashboards requires the right analytics strategy. This is where Power BI & Dynamics 365 Finance & Operations integration becomes critical.
By connecting Power BI to Dynamics 365 Finance & Operations, organizations can transform raw ERP data into interactive dashboards, real-time performance insights, and role-based reporting experiences. In this blog, we review the available integration options, common Power BI reporting scenarios, and best practices to build a scalable and secure analytics strategy.
What is Dynamics 365 Finance & Operations?
Dynamics 365 Finance & Operations is Microsoft’s enterprise cloud ERP platform for large and growing organizations. Formerly known as Dynamics AX, it is designed to manage complex financial structures and global operations. Companies use Dynamics 365 Finance & Operations to centralize accounting, supply chain, manufacturing, and distribution processes within a single system.
Dynamics 365 Finance & Operations consists of two primary applications: Dynamics 365 Finance and Dynamics 365 Supply Chain Management. Dynamics 365 Finance focuses on core financial management, including general ledger, budgeting, accounts payable, accounts receivable, project accounting, fixed assets, and multi-entity, multi-currency compliance. Dynamics 365 Supply Chain Management supports operational processes such as procurement, inventory management, manufacturing, warehousing, sales orders, and distribution. Together, these applications support end-to-end business operations across global organizations.
The platform also includes built-in reporting tools to support operational and financial visibility. SQL Server Reporting Services (SSRS) is used for structured financial statements and formatted reports. Embedded analytics provide role-based dashboards and real-time insights directly within the application.
What is Power BI?
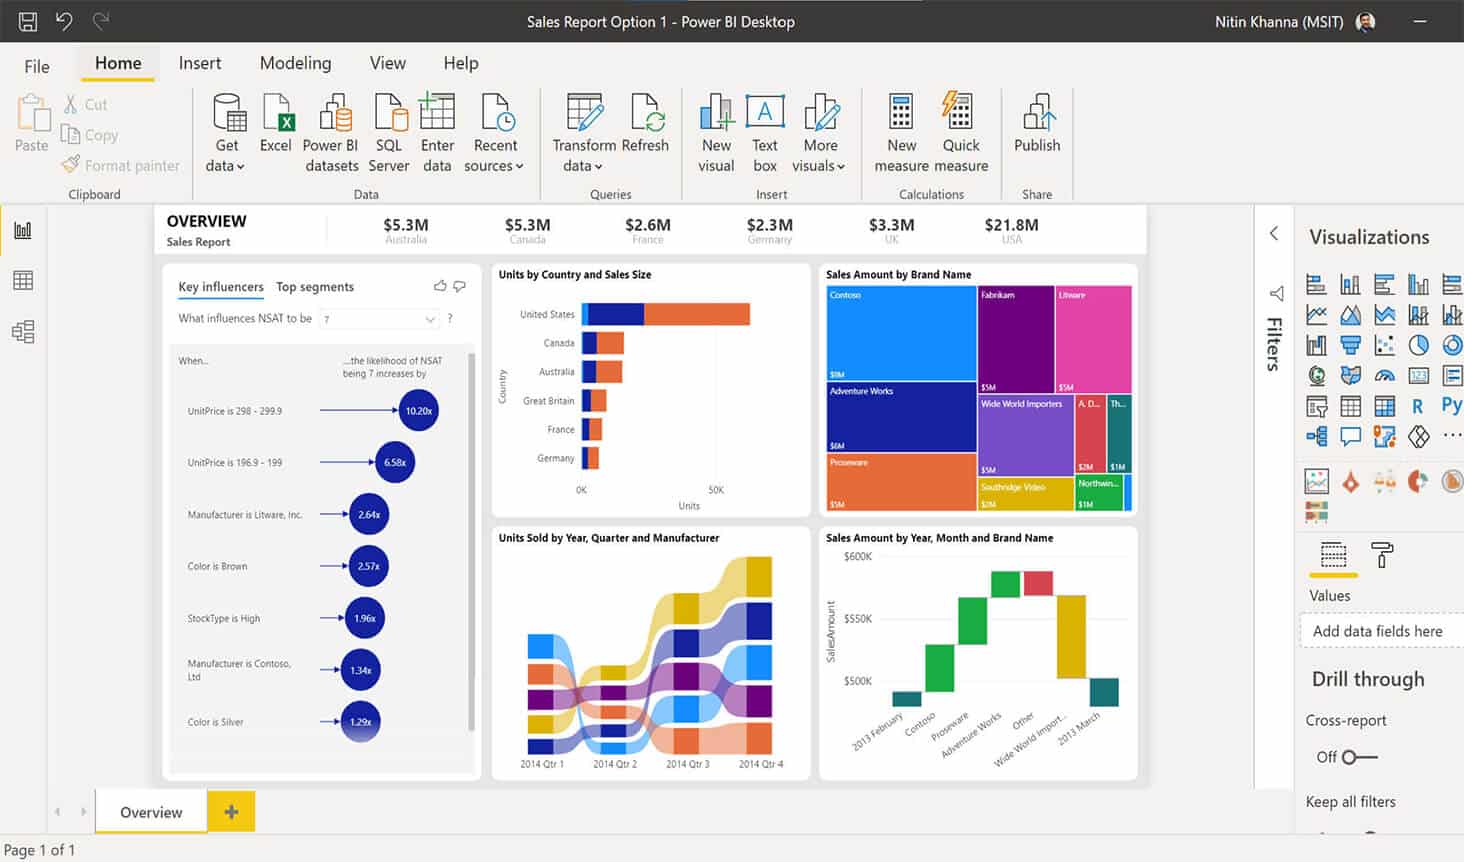
Power BI is Microsoft’s business intelligence and data visualization platform. It helps organizations connect to data, transform it, and present it in interactive dashboards and reports. Power BI includes tools for building reports and a cloud service for publishing, sharing, and securing analytics across the organization.
When used with Dynamics 365 Finance & Operations, Power BI enhances visibility across financial and operational data. Instead of relying on static exports or manual spreadsheets, leaders can analyze trends, monitor KPIs, and drill into transaction-level detail directly from dynamic dashboards.
Power BI provides:
- The ability to turn raw ERP data into dashboards and interactive reports
- Connectivity to multiple data sources, including ERP, CRM, Excel, Azure, and databases
- Real-time KPIs, drill-down analysis, and executive dashboards
- Customizable Power BI dashboards for Dynamics 365 Finance & Operations
- Support for embedded analytics experiences inside ERP applications
Power BI supports both operational and strategic analytics. Reports can be built as standalone BI assets or embedded directly within Dynamics 365 workspaces, allowing users to access analytics where work happens.
Why connect Dynamics 365 Finance & Operations with Power BI?
Dynamics 365 Finance & Operations is built to manage transactions and enforce business processes. Power BI is built to analyze, visualize, and explain data. When you connect Power BI & Dynamics 365 Finance & Operations, you move from static ERP screens to interactive analytics that show what changed, why it changed, and what to do next.
Power BI and Dynamics 365 Finance & Operations integration allows organizations to analyze financial and operational performance in real time. Instead of exporting data to spreadsheets, users interact with dashboards that update dynamically. Analytical workspaces powered by embedded Power BI allow teams to click into visuals, explore cause-and-effect relationships, and perform simple what-if analysis without leaving the ERP environment.
Key benefits include:
- Real-time financial visibility across entities, departments, and business units
- Operational performance analytics for supply chain, procurement, and manufacturing
- Executive dashboards tailored to CFOs and leadership teams
- Consolidated reporting across multi-company environments
- Embedded analytics directly within Dynamics 365 workspaces
- Predictive analytics layered on ERP data
- Forecasting, anomaly detection, and trend analysis
- AI-powered insights to support modern ERP intelligence
Power BI can layer predictive analytics on ERP data, enabling forecasting models, exception reporting, and advanced trend analysis. This strengthens D365 Finance & Operations analytics and supports proactive decision-making instead of reactive reporting.

Ready to connect Power BI and D365 F&O?
Rand Group helps organizations connect Power BI to Dynamics 365 Finance & Operations and design reporting strategies tailored to finance, supply chain, and executive leadership needs. If you’re looking to improve financial visibility, operational insight, or reporting performance, our team can design a solution that supports your business goals.
How to connect Power BI to Dynamics 365 Finance & Operations
There are several supported ways to connect Power BI to Dynamics 365 Finance & Operations. The best integration method depends on data volume, reporting complexity, performance requirements, and data freshness needs. Below are the primary integration options used to support Power BI reporting in D365 Finance & Operations.
Power BI embedded integration
Dynamics 365 Finance & Operations supports native Power BI Embedded integration. This allows dashboards and reports to appear directly inside the ERP interface. Instead of switching between systems, users can access Power BI dashboards for Dynamics 365 Finance & Operations within the same workspace where they manage transactions.
Embedded reports are tied to specific workspaces and can reflect user context such as company, role, or date range. This approach keeps analytics close to daily work. Users can click on visuals to drill into details, navigate to related pages, and take action immediately. Embedded analytics turn reports into interactive tools rather than static outputs.
With embedded Power BI:
- Dashboards and reports display directly inside D365 Finance & Operations workspaces
- Users can drill down into detailed pages from report visuals
- Reports can be filtered automatically based on user context, such as company or business unit
- Role-based security controls access to reports and navigation
- Developers and partners can embed custom PBIX reports into the application
- Reports support real-time data with DirectQuery scenarios
Analytical workspaces powered by Power BI
Analytical workspaces in Dynamics 365 Finance & Operations are built using Power BI Embedded. They are designed to give users a high-level view of business performance directly inside the ERP. Instead of reviewing separate reports, users see KPIs, charts, and key metrics within the same workspace where they manage daily processes.
These workspaces combine visuals, count tiles, and quick links into a single page. The goal is simple: provide a clear snapshot of the state of the business before users take action. Power BI visuals make the experience interactive, so analytics feel like part of the system rather than an external reporting tool.
With analytical workspaces:
- Users see KPIs, charts, and metrics in one consolidated view
- Visuals support drill-down into detailed transactions
- Reports can respond to user context, such as company or date filters
- DirectQuery enables real-time insight in many scenarios
- Infographics and third-party visuals create a highly visual experience
- Users can explore trends and perform simple what-if analysis without leaving the workspace
Power BI workspaces complement operational workspaces. Operational workspaces focus on processing transactions and completing tasks. Analytical workspaces focus on understanding performance, identifying trends, and highlighting exceptions. Together, they connect execution with insight.
Advanced integration options
For many organizations, embedded Power BI and analytical workspaces provide everything needed for day-to-day reporting. However, larger or more complex environments may require additional data architecture to support high data volumes, cross-system analytics, or specialized reporting needs. Microsoft supports several advanced integration options for Power BI & Dynamics 365 Finance & Operations that allow you to scale beyond standard ERP dashboards.
The right approach depends on your reporting goals, data volume, and long-term analytics strategy. Below are the most common advanced integration patterns used to support enterprise-level Dynamics 365 Finance & Operations Power BI reporting.
- Entity Store integration: Entity Store is the built-in reporting data store within Dynamics 365 Finance & Operations. It stages aggregated data in a reporting-friendly format that is optimized for analytics rather than transactions. This option works well for high-volume operational dashboards and near-real-time analytics using Power BI DirectQuery.
- OData (Data Entities) integration: Dynamics 365 Finance & Operations exposes data entities through standard OData endpoints. Power BI can connect directly to these endpoints for targeted reporting scenarios. This approach is best for smaller datasets, department-level dashboards, or lightweight analytics that do not require enterprise-scale performance.
- Azure Data Lake integration (Synapse / Fabric): Azure Data Lake integration allows organizations to export large volumes of ERP data into a centralized cloud data platform. Power BI can then combine ERP data with CRM, external systems, or historical data for enterprise analytics. This option is ideal for organizations building a long-term business intelligence and AI strategy.
- BYOD (Bring Your Own Database): BYOD enables administrators to export data entities into their own Azure SQL database. Power BI can connect directly to that database for custom reporting, historical snapshots, or integration with other systems. This option is often used when direct SQL access or structured ERP-to-SQL reporting pipelines are required.
These advanced integration options provide flexibility for organizations that need more than embedded dashboards, while still supporting a scalable and secure ERP analytics strategy.
Common Power BI reporting scenarios for Dynamics 365 Finance & Operations
Power BI dashboards for Dynamics 365 Finance & Operations are typically designed around core business functions. While every organization has unique requirements, most reporting initiatives focus on financial visibility, operational performance, and executive oversight. Below are the common types of Dynamics 365 Finance & Operations Power BI reporting scenarios used across finance and operations teams.
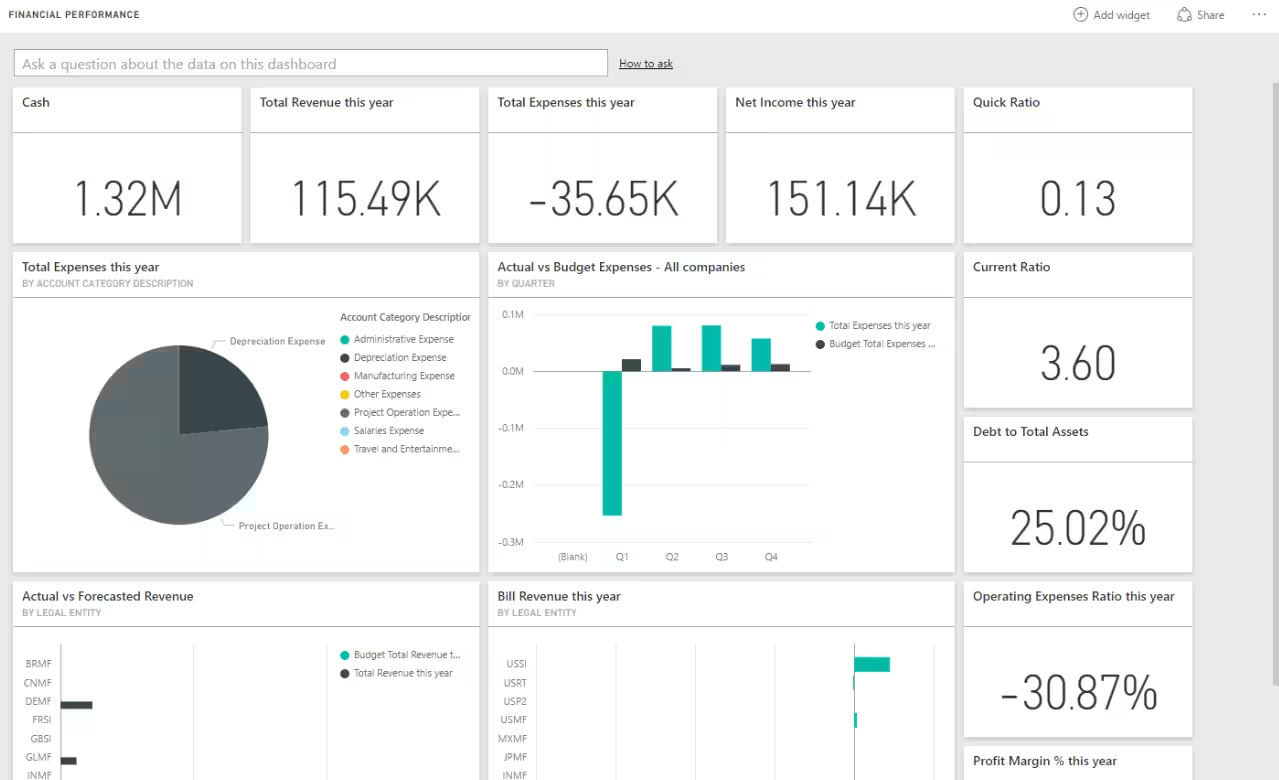
Financial reporting
Financial reporting is one of the most common use cases for Power BI & Dynamics 365 Finance & Operations integration. Power BI enhances traditional financial statements by adding interactive filtering, drill-down capabilities, and trend analysis. Instead of reviewing static SSRS reports, finance teams can monitor performance in real time.
Common financial Power BI reports include:
- Revenue, expenses, and net income
- Gross margin and current ratio
- Budget vs actual analysis
- Expenses by account category
- Accounts payable and accounts receivable balances
- Fixed asset performance
- Cash overview and cash flow forecast
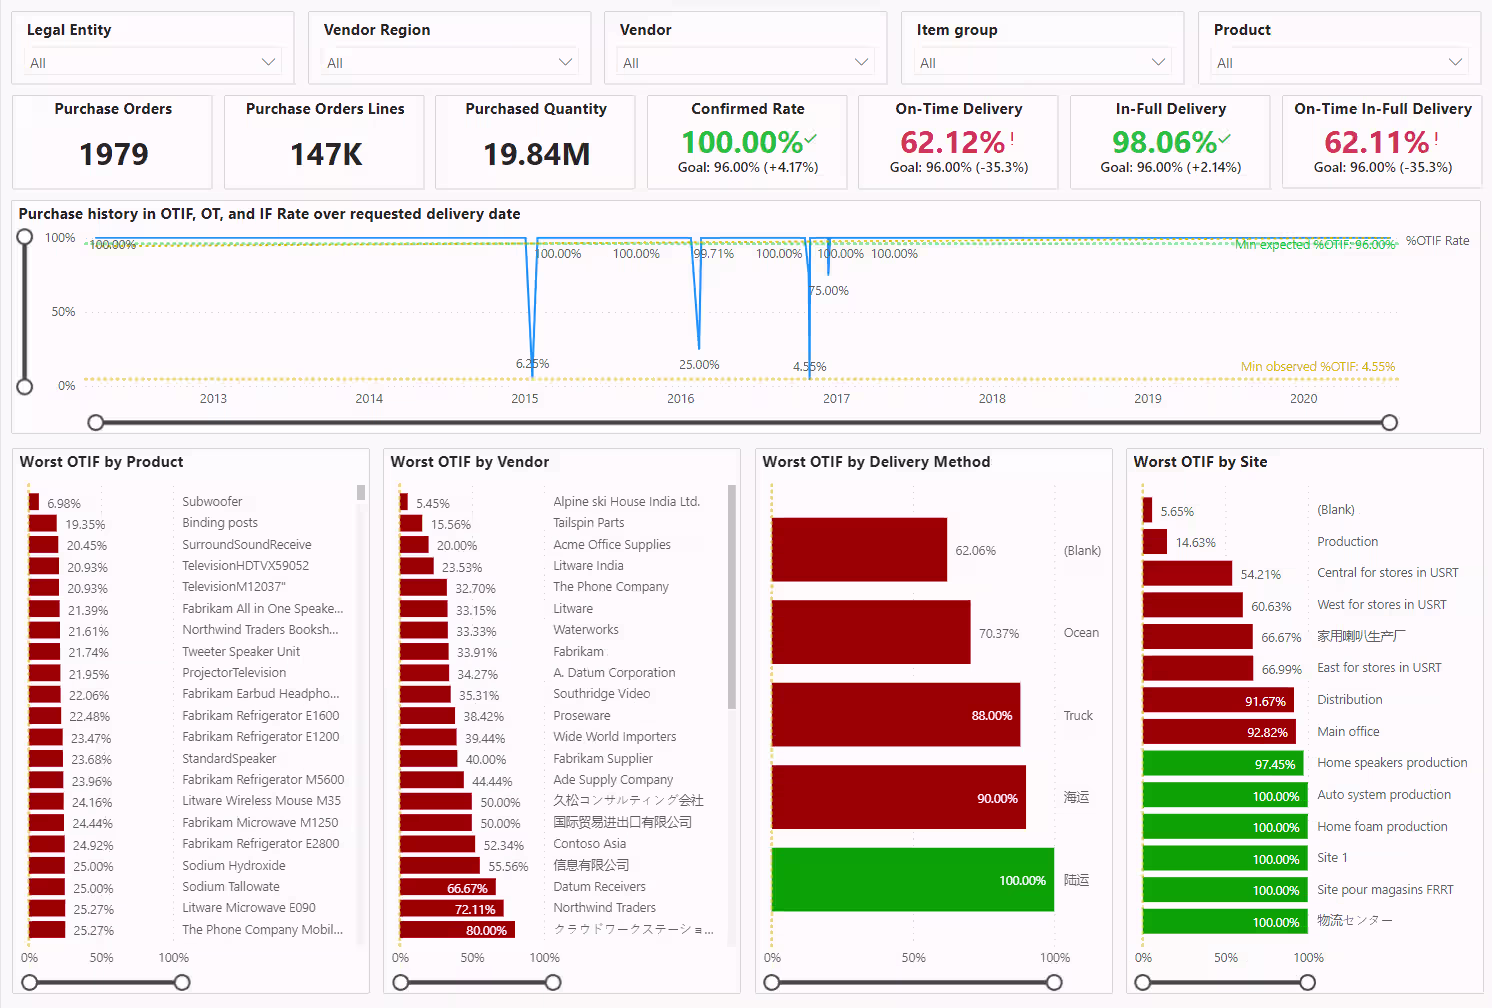
Supply chain dashboards
Supply chain teams use Power BI to monitor operational performance across procurement, inventory, and warehousing. These dashboards provide visibility into trends, exceptions, and bottlenecks that are difficult to identify in transactional screens. With embedded analytics, supply chain leaders can move from insight to action quickly.
Common supply chain Power BI dashboards include:
- Inventory aging and on-hand balances
- Vendor performance metrics
- Purchase spend analysis
- Warehouse performance
- Production performance
- Sales and profitability performance
- Credit and collections management
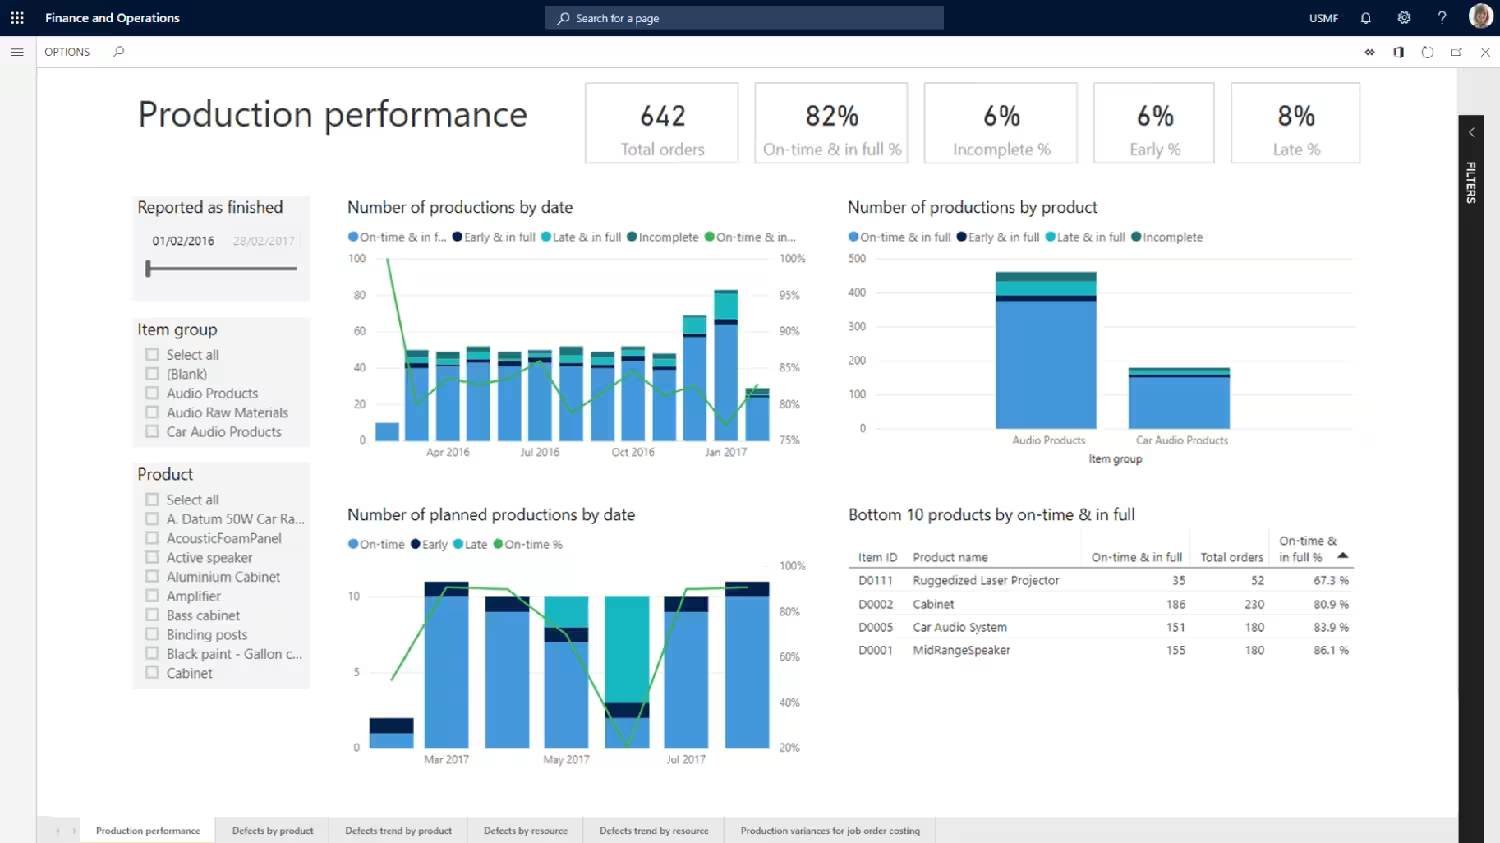
Manufacturing analytics
Manufacturing organizations use Power BI to analyze production efficiency, costs, and resource utilization. These dashboards support better planning and faster response to operational variances. By combining ERP transactions with analytics, organizations gain deeper insight into plant performance.
Common manufacturing Power BI reports include:
- Production performance and throughput
- Capacity utilization
- Cost accounting analysis
- Variance analysis
- Work-in-progress tracking
- Inventory consumption trends
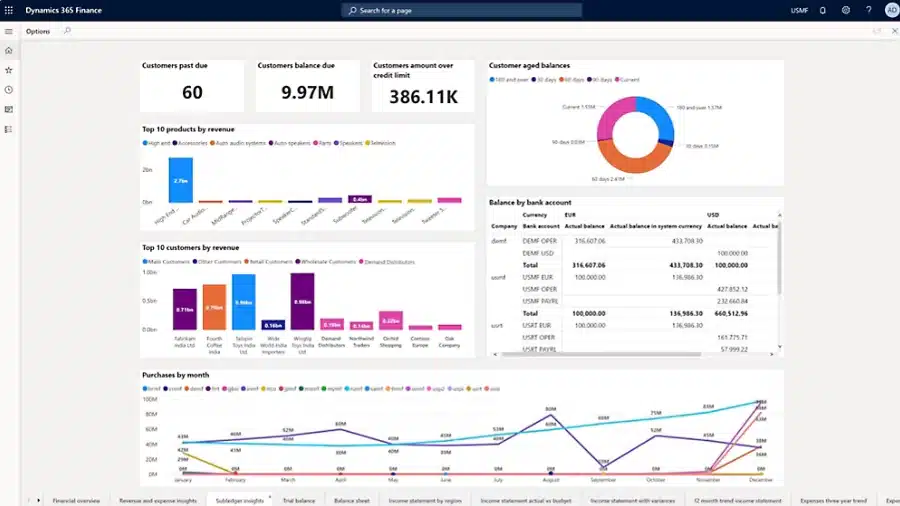
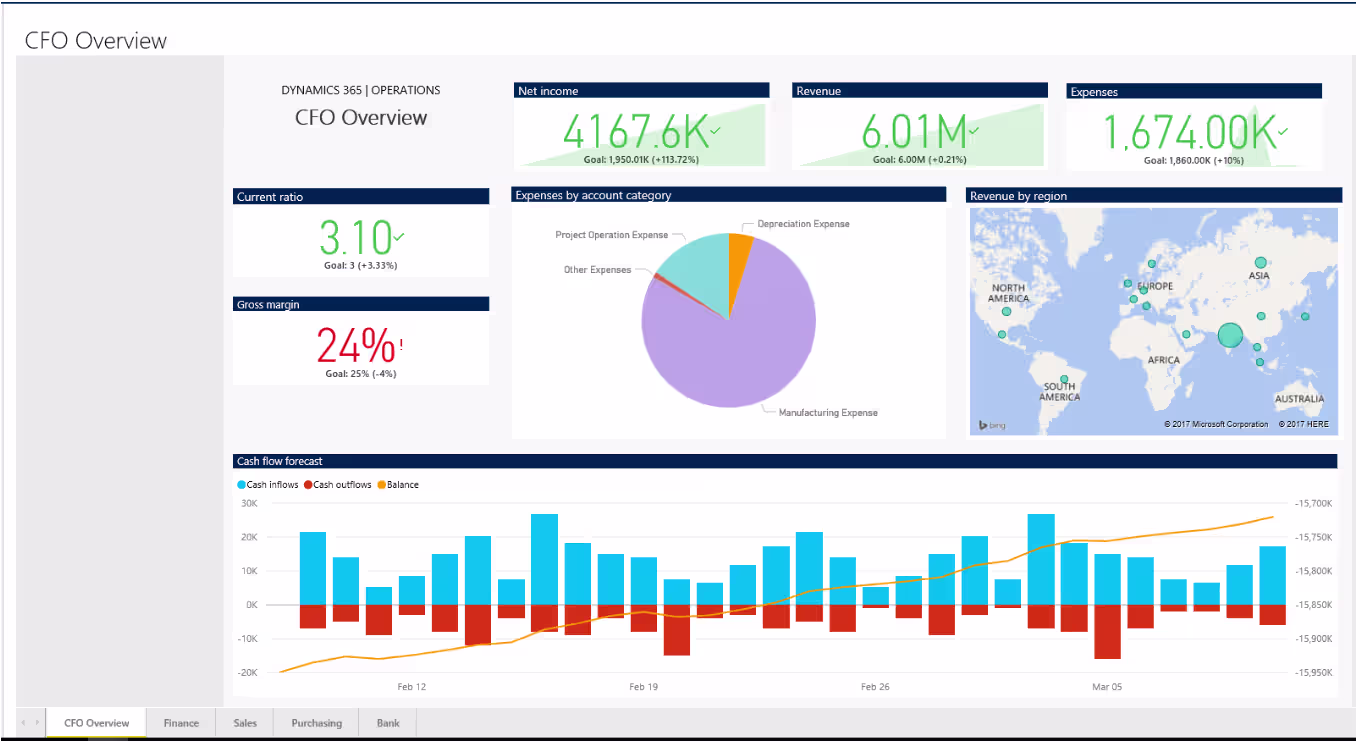
CFO dashboard
The CFO dashboard is designed to provide executive-level visibility across financial and operational performance. In Dynamics 365 Finance & Operations, the CFO overview workspace combines data from financial performance, cash management, sales, and purchasing into a single executive view. This supports faster, data-driven decision-making at the leadership level.
Common CFO dashboard reports include:
- Revenue, expenses, and net income overview
- Cash flow forecast and bank balances
- Revenue by region
- Top customers and top products by revenue
- Aged receivables and customer past due balances
- Purchase trends and top vendors
Best practices for Power BI & Dynamics 365 Finance & Operations integration and reporting
Successful Power BI & Dynamics 365 Finance & Operations integration requires planning and alignment. Dashboards should support clear business objectives, not just display data. A structured approach ensures your reporting environment remains scalable, secure, and aligned with your overall ERP business intelligence strategy.
- Choose the right integration method: Match your architecture to your data volume and reporting complexity. Embedded analytics and Entity Store often meet operational needs, while Azure Data Lake or BYOD approaches support enterprise-scale analytics. Avoid overengineering when simpler options will achieve your reporting goals.
- Define KPI requirements early: Identify the metrics that matter most to finance, operations, and executive leadership before building dashboards. Clearly defined KPIs prevent dashboard sprawl and keep reporting focused on measurable business outcomes. This reduces rework and improves long-term consistency.
- Keep dashboards focused and simple: Limit each dashboard to a clear theme, such as financial performance or inventory health. Too many visuals reduce clarity and can impact performance. Focused dashboards improve usability and user adoption.
- Separate operational and executive dashboards: Operational users need detailed, task-oriented dashboards, while executives need high-level summaries and trend analysis. Designing separately for each audience improves clarity and decision-making. One dashboard should not attempt to serve every role.
- Leverage embedded analytics where work happens: Embed Power BI dashboards into analytical workspaces whenever possible. Users are more likely to adopt reporting tools that are part of their daily workflow. This strengthens overall D365 Finance & Operations analytics maturity.
- Align analytics with your ERP strategy: Reporting should support long-term ERP and digital transformation goals. Power BI dashboards should evolve as business processes evolve. Treat analytics as part of your broader Dynamics 365 Finance & Operations roadmap, not as a standalone initiative.
How Rand Group helps with Power BI & Dynamics 365 Finance & Operations reporting
Rand Group helps organizations connect Power BI to Dynamics 365 Finance & Operations and build reporting strategies that deliver measurable business value. As a Microsoft Solutions Partner with deep ERP and analytics experience, we align technical integration decisions with finance, supply chain, and executive reporting objectives. Our focus is practical: design the right architecture, build meaningful dashboards, and ensure long-term reporting performance.
Our services include:
- Power BI & D365 F&O integration strategy: Assess your current ERP and reporting environment and recommend the appropriate integration approach based on data volume, performance needs, governance requirements, and long-term analytics goals.
- Financial and operational reporting development: Design and build role-based Power BI dashboards for finance, supply chain, manufacturing, and executive leadership. We translate ERP data into KPIs, trend analysis, and decision-ready reporting.
- Data modeling and performance optimization: Structure and refine your data models to improve report performance, scalability, and usability. This ensures dashboards remain responsive as data volumes grow.
- Ongoing optimization and support: Continuously enhance dashboards, refine KPIs, improve performance, and align reporting with evolving business processes and ERP strategy.
Frequently asked questions (FAQs)
How do I connect Power BI to Dynamics 365 Finance and Operations?
You connect Power BI to Dynamics 365 Finance & Operations using embedded analytics, Entity Store, OData data entities, Azure Data Lake (Synapse/Fabric), or BYOD (Bring Your Own Database). The best method depends on reporting complexity, data volume, and performance needs. Most organizations begin with embedded dashboards and expand as analytics requirements grow.
Do I need a Power BI license to use Power BI inside Dynamics 365 Finance & Operations?
No, customers do not need a separate Power BI license to use embedded analytics inside Dynamics 365 Finance & Operations. Power BI Embedded capabilities are included within the application. However, a Power BI Pro or Premium license is required if users connect to Entity Store from PowerBI.com using DirectQuery or share reports in the Power BI service.
Can I customize Power BI embedded reports in Dynamics 365 Finance & Operations?
Yes, Power BI embedded reports in Dynamics 365 Finance & Operations can be customized. Organizations can modify existing reports, create new PBIX files, and embed them into analytical workspaces. Custom dashboards can reflect company-specific KPIs, filters, security roles, and reporting requirements while maintaining integration with ERP data.
What is the best integration method for Power BI and Dynamics 365 Finance & Operations?
The best integration method depends on reporting scale and business objectives. Embedded analytics and Entity Store are ideal for operational dashboards and near-real-time reporting. Azure Data Lake or BYOD are better suited for enterprise analytics, cross-system reporting, and long-term data architecture strategies.
Can Power BI provide real-time reporting for Dynamics 365 Finance & Operations?
Power BI can support real-time reporting when using DirectQuery with Entity Store or embedded analytics. Data updates can occur frequently without manual exports, depending on configuration. In high-volume environments, organizations typically balance data freshness with performance and governance requirements.
What types of reports are commonly built with Power BI and D365 Finance & Operations?
Common reports include financial performance dashboards, supply chain analytics, manufacturing performance reporting, and executive CFO dashboards. Organizations frequently build revenue and expense analysis, budget vs actual comparisons, inventory health metrics, and cash flow forecasts. Reporting is typically role-based to align insights with finance, operations, and leadership users.
Next steps
Power BI & Dynamics 365 Finance & Operations integration enables organizations to move from transactional reporting to actionable insight. The right architecture and dashboard strategy can improve financial visibility, operational performance, and executive decision-making.
If you’re evaluating integration options or looking to enhance your reporting strategy, Rand Group can help. Contact us to learn more about connecting Power BI to Dynamics 365 Finance & Operations and building a scalable analytics roadmap.