Dynamics 365
 Power Platform
 Dynamics
What is the ROI of Microsoft Dynamics 365 Business Central?

Every organization evaluating a new ERP system eventually asks the same question: what is the actual return on investment? According to a March 2026 Forrester Total Economic Impact™ study commissioned by Microsoft, organizations implementing Microsoft Dynamics 365 Business Central achieved a projected 209% ROI over three years, with a net present value of $464,000 and a payback period of under six months.
But ERP ROI is rarely as simple as a single statistic. Finance leaders, operations teams, and executives need to understand where those returns actually come from — whether through finance automation, reduced legacy system costs, improved reporting efficiency, stronger operational visibility, or long-term scalability. The challenge is that many ERP business case discussions focus only on software features while overlooking the operational and financial realities that drive real-world ERP implementation ROI.
This blog breaks down what the Forrester research actually found, where Business Central ROI is typically realized in practice, and how organizations across manufacturing, distribution, retail, and professional services are using Microsoft Dynamics 365 Business Central to modernize operations, reduce total cost of ownership, and improve profitability over time.
- What does ROI actually mean for an ERP?
- The independent research baseline — what Forrester found
- How finance productivity improvements drive Business Central ROI
- How reducing legacy system costs improves Business Central ROI
- How profitability improvements compound Business Central ROI
- How reporting and audit efficiency strengthen Business Central ROI
- What Forrester identified beyond measurable ROI
- How long does it take to achieve Business Central ROI?
- Common reasons Business Central ROI falls short
- How to build your own Business Central business case
- Why choose Rand Group
- Frequently asked questions
What does ROI actually mean for an ERP?
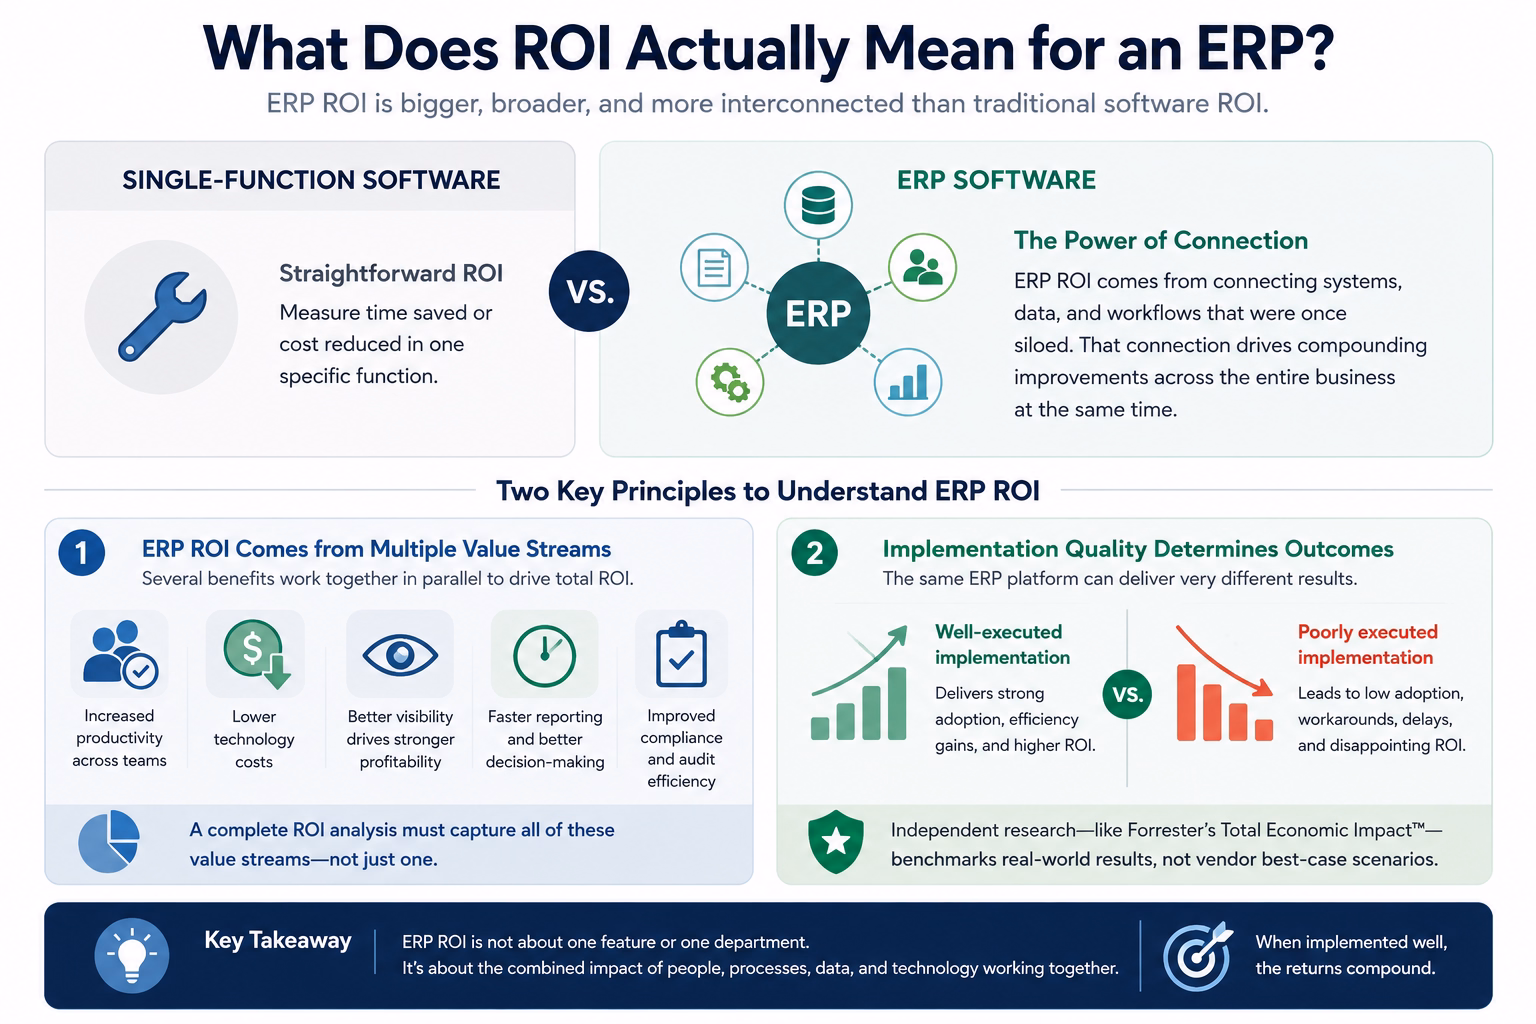
Before looking at specific numbers, it helps to understand why ERP ROI works differently than most software ROI calculations. When you invest in a single-function tool, the ROI is usually straightforward. You measure time saved or cost reduced in that specific function.
ERP ROI is more complex. The value does not come from one feature. It comes from the compounding effect of connecting systems, data, and workflows that were previously fragmented. That connection creates improvements across multiple parts of the business at the same time.
This means two things for how you should think about it.
First, ERP ROI typically comes from several value streams at once. Productivity gains in finance, reduced technology costs, better profitability through improved visibility, and faster reporting all happen in parallel. Any honest ROI analysis needs to account for all of them.
Second, ERP ROI is highly sensitive to implementation quality. The same platform, deployed by two different partners with two different levels of care, can produce very different outcomes. This is exactly why independent research like Forrester’s Total Economic Impact methodology is useful. It models results across real organizations rather than projecting best-case scenarios.
For Business Central specifically, Forrester identified four categories of measurable ROI. Think of these as a useful framework for evaluating the investment:
- Finance team productivity
- Legacy system and point solution cost reduction
- Profitability improvement through better cost visibility
- Reporting and audit efficiency
The independent research baseline — what Forrester found
In March 2026, Forrester Consulting published a Total Economic Impact™ study examining the ROI organizations may realize by deploying Business Central. Microsoft commissioned the study.
Forrester interviewed four real decision-makers: a CTO in retail, a COO in professional services, a Senior VP of operations in manufacturing, and a CFO in finance. They combined those interviews into a composite organization with $50 million in annual revenue, 300 employees, and 15 core finance and accounting users running Business Central in the cloud.
The results were significant.
Those numbers represent a composite model. They are not a guarantee for any single organization. However, they reflect the aggregated experience of real businesses across different industries and sizes. That makes them a credible starting point for building your own business case. See how Forrester built the financial case for Business Central for additional context on the research.
As one COO in professional services told Forrester: their organization had accumulated a mix of systems over time, and maintaining them was expensive. They wanted to consolidate everything into one platform. That story will sound familiar to many organizations reading this.
The sections below break down where that 209% ROI actually comes from.

See what Business Central ROI could look like for your organization
Every organization’s ROI looks a little different. Rand Group can help you understand what Business Central would realistically deliver for your business — based on your current systems, your team, and your growth goals. No pressure, no generic pitch. Just an honest conversation.
How finance productivity improvements drive Business Central ROI
For most organizations, the finance team is where inefficiency is most visible and most costly. Manual processes, disconnected systems, and spreadsheet-dependent workflows slow down everything from daily transaction processing to month-end close. Addressing those bottlenecks is one of the fastest and most measurable ways Business Central delivers ROI.
What Forrester found
Forrester’s study found that Business Central improves finance team productivity by up to 50% in accounts payable, accounts receivable, and billing workflows by Year 3. Monthly time to close drops by up to 30%. The value of those productivity gains totals $215,719 over three years for the composite organization.
A CFO interviewed in the study described it this way: Business Central allowed their team to harmonize processes, making them more efficient and reducing time spent on routine administrative work.
What this means in practice
In our experience, a faster close almost always comes from two specific changes. The first is eliminating spreadsheet dependency. The second is consolidating financial data into a single system of record. Most finance teams are not slow because their people are slow. They are slow because their data lives in three or four different places and reconciliation is manual. When that friction is removed, the close accelerates quickly.
The 50% productivity improvement in AP, AR, and billing surprises people until they map out how their team actually spends its time today. Manual data entry, invoice matching, and approval-chasing across email threads consume a large portion of the day in most organizations we work with. Business Central automates that routine work. It does not eliminate those roles. Instead, it redirects them toward forecasting, analysis, and the strategic finance work that usually gets pushed aside when teams are stretched thin.
What this looks like for real organizations
Cirkul, a fast-growing U.S. beverage manufacturer, was relying on spreadsheets and messaging apps to manage basic financial and operational processes before implementation. After implementing Business Central with Rand Group, they gained real-time cost visibility and the operational control needed to scale quickly.
“We were relying on spreadsheets and messaging just to keep processes moving — something a proper ERP should handle automatically. Today, we have better control of inventory, clear visibility into costs, and a system that supports our growth instead of holding us back.” — Sander Sharp, VP of IT, Cirkul
That clarity is what enabled Cirkul to onboard 13 new retail partners — including Walmart, Kroger, and Albertsons — in four months. The finance productivity gain was not the headline. But it was what made that scale of growth operationally possible.
How reducing legacy system costs improves Business Central ROI
Most organizations underestimate what their current technology environment actually costs them. Licensing fees, infrastructure maintenance, IT support hours, and the risk of relying on systems only a handful of people understand; these expenses are real, but they are rarely visible in a single budget line. Modernizing to Business Central gives organizations a clear opportunity to reduce that hidden overhead while building on a platform that scales.
What Forrester found
Forrester found that modernizing to Business Central reduces total cost of ownership by 14%. This comes from retiring legacy system maintenance, eliminating hardware costs, and consolidating third-party point solutions. The present value of these savings totals $175,121 over three years.
The organizations Forrester interviewed described the same pattern. Their IT environments had grown over time through acquisition or expansion. They were running multiple disconnected tools and homegrown systems. Integration was difficult, visibility was limited, and maintenance was expensive. Some older systems were built in outdated coding languages. Finding staff who could support them was slow and costly.
What this means in practice
The 14% TCO reduction is consistently where we find the biggest gap between what organizations think the net investment will be and what it actually is after accounting for savings.
Before implementation, most clients have never done a full accounting of what their current technology stack actually costs. The licenses, the infrastructure, the IT hours spent on maintenance, and the key-person risk when only one or two employees fully understand the system — these costs are real. They are just rarely visible in a single budget line.
What we commonly see is that organizations are running four to eight tools that Business Central can partially or fully replace. Those costs are spread across IT, finance, and operations budgets. When you consolidate them, the savings often offset a meaningful portion of the implementation investment before you have counted a single productivity hour.
What this looks like for real organizations
AGT Products Inc., a building materials manufacturer, was running a legacy ERP with manual order entry, siloed data, and paper-based processes that limited both visibility and growth. After moving to Business Central with Rand Group, AGT automated 90% of their daily order entry and saw a 20% increase in same-store sales.
“Business Central lets us automate workflows, integrate multiple apps, and scale operations quickly, while Rand Group guided us to adapt the platform exactly to our business needs.” — Kenny Jeans, VP Corporate Services, AGT Products Inc.
Beyond the immediate cost savings, retiring a legacy system also removes the organizational risk that comes with it — the key-person dependency, the maintenance burden, and the ceiling it puts on what the business can do next.
How profitability improvements compound Business Central ROI
Profitability rarely erodes all at once. It happens gradually, through project overruns that go unnoticed, inventory that carries more cost than it should, and spending patterns that never get reviewed because the data is too hard to access. Business Central gives organizations the visibility to see those problems clearly and the tools to act on them before they compound further.
What Forrester found
Forrester found that Business Central enables organizations to improve net profit margin relative to baseline by up to 3%. This comes from better cost visibility, which allows organizations to track, analyze, and reduce wasteful spending. The value of this improvement totals $245,530 over three years for the composite organization.
What this means in practice
A 3% margin improvement sounds modest until you apply it to revenue. For a $50 million organization, the size of Forrester’s composite is $1.5 million in additional profitability per year.
The mechanism is not complicated. Organizations that can see their costs in real time make better decisions. They catch project overruns earlier. They identify inventory carrying more cost than it should. They recognize vendor spend patterns that need renegotiating. Business Central does not fix those problems automatically. However, it makes them visible, and visibility is the prerequisite for fixing them.
What we commonly see across implementations is that the profitability improvement does not arrive from one big change. It accumulates gradually as teams gain confidence in the data and start making decisions they previously lacked the visibility to make.
What this looks like for real organizations
Bartek Ingredients, the world’s largest producer of malic and fumaric acid, was running paper-based production orders before working with Rand Group. Costing data was always delayed, always approximate, and rarely reliable enough to drive real decisions at scale.
After implementing Business Central alongside Power Apps and Power BI, raw material stock-outs dropped sharply, production waste was reduced, and the finance team gained the cost accuracy needed to make faster, more informed decisions across their global operations.
“Without Business Central and Power Apps, we couldn’t keep up with what our customers expect. Now we can trace anything across the entire ecosystem, reduce waste, and make smarter business decisions quickly.” — Steven Chambers, CFO, Bartek Ingredients
That is what a 3% margin improvement can look like when it is working in practice.
How reporting and audit efficiency strengthen Business Central ROI
Reporting inefficiency is one of the most normalized pain points in finance. Many teams simply accept that pulling together accurate, consolidated financial data takes days — because it always has. Business Central changes that assumption by centralizing data into a single system, making reporting faster, more accurate, and far less dependent on manual effort.
What Forrester found
Forrester found that Business Central reduces audit preparation time by up to 30%. It provides a consolidated view of financial and business data. As a result, organizations no longer need to manually pull information from multiple sources for audits or executive presentations. The present value of these time savings totals $49,372 over three years.
What this means in practice
The audit efficiency benefit consistently gets the strongest reaction from finance teams. Not because the dollar figure is the largest — but because audit preparation is something every controller and CFO has a visceral reaction to.
From what we’ve observed, the pain is rarely the audit itself. It is the preparation. When financial data lives across multiple systems and spreadsheets, assembling a defensible picture of the business becomes a manual, time-consuming exercise that happens several times a year.
What Business Central changes is the underlying architecture. When transactions are recorded in one system with consistent dimensions and posting structures, audit-ready reporting becomes a byproduct of normal operations. Organizations are not reconstructing their financial history for every reporting event. The data is already there, already organized, and already accurate.
What this looks like for real organizations
This dynamic shows up most clearly in multi-entity organizations, where consolidated reporting previously meant pulling data from separate systems, normalizing formats, and reconciling discrepancies before anyone could see a reliable picture of performance.
Canadian Spa Company, which serves retailers across Canada, the U.S., and the UK, was operating across multiple disconnected systems before Rand Group implemented and optimized Business Central. After centralizing onto a single platform, the results were cleaner data, stronger inventory control, and a scalable ERP foundation that supported growth across multiple entities and geographies.
“Rand Group gives us the knowledge and the information to make the proper business decision to expand our business to that next level and open up new revenue opportunities.” — Nigel Paskinov, Managing Director, Canadian Spa Company
In practice, that meant having financial data they could trust — which is the foundation for both faster reporting and the strategic decisions that reporting is meant to enable.
What Forrester identified beyond measurable ROI
While Forrester’s March 2026 Total Economic Impact™ study quantified the measurable financial return of Microsoft Dynamics 365 Business Central, it also identified several operational benefits that are harder to model consistently across organizations. These benefits may not always appear in a formal ERP ROI calculation, but they often create meaningful long-term business value.
Some of the most common unquantified benefits included:
- fewer billing errors and faster invoice delivery
- reduced days sales outstanding (DSO)
- improved cash flow visibility
- faster warehouse and fulfillment processes
- lower inventory carrying costs
- improved customer experience
In practice, these are often the improvements organizations notice first after go-live. Faster invoicing, cleaner workflows, and centralized data can improve cash flow and operational efficiency well before broader profitability gains fully mature.
The AI readiness benefit is also becoming increasingly important. Organizations with standardized data and connected workflows are far better positioned to adopt Microsoft Copilot, AI agents, and automation tools across finance and operations. However, most businesses begin with fragmented data and spreadsheet-driven processes. A successful Business Central implementation helps establish the structured foundation needed to support future AI initiatives and long-term scalability.
How long does it take to achieve Business Central ROI?
This is one of the most common questions we hear before an engagement begins. The honest answer depends on three variables.
The first is implementation scope. A focused, well-scoped deployment reaches value faster than a broad, heavily customized one.
The second is deployment methodology. Organizations using a rapid activation approach often see measurable productivity improvements within 60 to 90 days of go-live. The manual processes they were running before consume so much daily effort that the improvement is immediate and noticeable.
The third is where the organizational pain is concentrated. Organizations with the most acute manual process problems tend to see the earliest, most visible returns.
Forrester’s model projects a payback period of under six months, based on a four-month implementation timeline for the composite organization. In practice, longer-tail ROI — particularly the profitability improvement and the cost reduction from retiring legacy tools — tends to accumulate over the first 12 to 18 months as teams build confidence in the system and begin using its capabilities more fully.
For organizations where the current system is actively holding the business back, time to ROI is often shorter than people expect. The implementation timeline is typically the longest part of the wait.
Common reasons Business Central ROI falls short
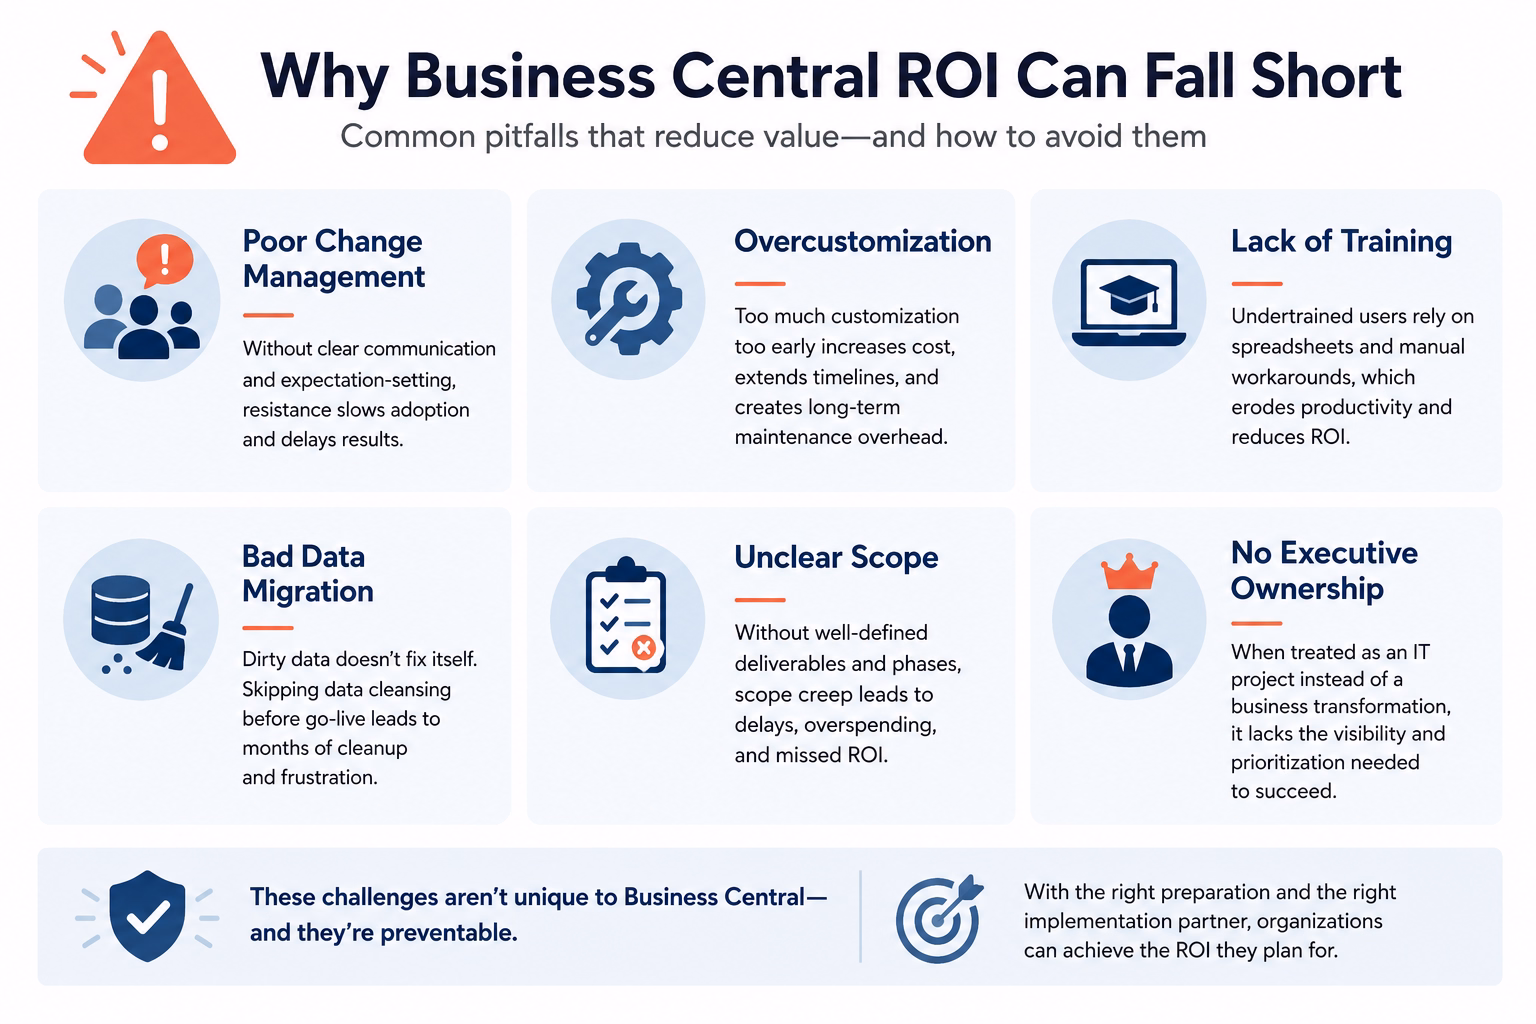
Business Central has a strong track record. But not every implementation delivers on its potential. In practice, the gap between projected ROI and actual ROI almost always traces back to one or more of the same recurring problems.
- Poor change management. When employees are not brought along through the transition with clear communication and expectation-setting, resistance slows adoption and delays results.
- Overcustomization. Heavy customization before teams have lived in the system increases cost, extends timelines, and creates maintenance overhead that compounds over time.
- Lack of training. Undertrained users default to spreadsheets and manual workarounds, which directly erodes the productivity gains that drive a significant portion of ROI.
- Bad data migration. Dirty data brought into a new system does not fix itself. Organizations that skip proper data cleansing before go-live spend months correcting errors afterward.
- Unclear scope. Implementations without well-defined deliverables and phases tend to expand, delay, and overspend. Scope creep is one of the most common reasons ERP projects run over budget.
- No executive ownership. When Business Central is treated as an IT project rather than a business transformation, it loses the internal visibility and prioritization it needs to succeed.
None of these are unique to Business Central. And all of them are avoidable with the right preparation and the right partner.
How to build your own Business Central business case
Building a credible internal business case does not require a complex financial model. It requires honest answers to the right questions. Here is the five-step framework we walk clients through.

Total your current technology costs honestly
List every license, every infrastructure cost, every IT support hour, and the organizational cost of key-person dependency on systems only a few people understand. Most organizations significantly underestimate this number before they sit down and add it up.

Map your finance team's manual hours
Use Forrester’s benchmark of up to 50% productivity improvement in AP, AR, and billing as a starting point. Then pressure-test it against how your team actually spends its time today.

Identify where you are losing margin without knowing it
Look for project overruns that went unnoticed too long. Inventory carrying more cost than it should. Vendor spend that has not been reviewed recently. This is usually where the largest ROI lives and where the least visibility currently exists.

Account for what growth actually requires
Can your current systems support the business you are building over the next two to three years? Or will you hit the same ceiling again in 18 months?

Get a scoped estimate before you commit
Business Central implementation costs typically range from $25,000 to $250,000 or more for a complex, multi-entity deployment. The right partner scopes before they sell.
Before we quote any engagement at Rand Group, we spend time understanding what it is costing a client to do nothing. That conversation almost always changes how the investment is framed internally. For more details on what implementation involves, see Rand Group’s Business Central implementation guide.

White Paper
Not sure if your Business Central investment is delivering what it should?
The right support partner makes the difference between a Business Central system that performs and one that plateaus. Rand Group’s whitepaper covers the seven criteria every organization should evaluate when choosing a Business Central support partner — including the questions most organizations forget to ask.
Why partnering with Rand Group drives ROI
Forrester’s model projects a 209% ROI for a composite organization. That composite assumes a successful implementation. What the research cannot account for is the significant variance in real-world outcomes that comes from how the implementation is scoped, executed, and supported after go-live.
Based on what we’ve seen, the organizations that realize the strongest Business Central ROI share a few consistent characteristics. They invest time in proper requirements gathering before go-live. They treat user adoption training as essential rather than optional. And they work with a partner who stays engaged after implementation — not one who moves on once the project closes. The organizations that struggle are almost always dealing with one of the inverse conditions. An under-scoped implementation. An undertrained team. A partner relationship that ended at go-live.
This is where Rand Group’s approach is different. We do not hand off a system and disappear. Many of our clients who come to Rand Group moved from a different Business Central partner — often because the previous implementation delivered far less than it promised. Our Business Central rescue and recovery services exist precisely because poor implementations are more common than the industry admits.
Rand Group was named the 2025 Microsoft Americas Channel Emerging Partner of the Year. We maintain a 90% client retention rate and were among the first North American partners to earn the Microsoft Small and Midsize Business Management Advanced Specialization. Those credentials are not marketing language. They reflect a consistent track record of implementations that actually deliver — and partnerships that continue long after go-live.
Frequently asked questions about Business Central ROI
What is the ROI of Microsoft Dynamics 365 Business Central?
According to a March 2026 Forrester Total Economic Impact™ study commissioned by Microsoft, organizations implementing Microsoft Dynamics 365 Business Central achieved a projected 209% ROI over three years, with a net present value of $464,000 and a payback period of under six months. Business Central ROI typically comes from finance automation, reduced legacy system costs, improved reporting efficiency, and better operational visibility. Actual ROI varies based on implementation quality, business complexity, and organizational adoption.
How long does it take to see ROI from a Business Central implementation?
Most organizations begin realizing Business Central ROI within 30 to 90 days after go-live, particularly through improvements in accounts payable, accounts receivable, billing automation, and reporting efficiency. According to Forrester’s research, the average payback period for Dynamics 365 Business Central is under six months. Longer-term ROI drivers, including profitability improvements and legacy system cost reductions, typically compound over 12 to 18 months as teams optimize processes and increase system adoption. Rand Group’s D365 Business Central implementation guide covers what to expect at each stage.
How much does a Microsoft Dynamics 365 Business Central implementation cost?
Microsoft Dynamics 365 Business Central implementation costs typically range from $25,000 for smaller, focused deployments to $250,000 or more for complex, multi-entity organizations with advanced integrations and custom requirements. Total implementation cost depends on factors such as company size, number of users, data migration complexity, process customization, reporting requirements, and third-party integrations. A properly scoped implementation helps organizations maximize Business Central ROI while minimizing unnecessary customization and long-term maintenance costs.
How do you build a Business Central ROI business case?
A strong Business Central ROI business case starts with identifying the operational and financial limitations of your current ERP environment. Organizations should evaluate manual finance processes, reporting inefficiencies, legacy software costs, infrastructure expenses, spreadsheet dependency, and visibility gaps that impact profitability. Comparing those costs against expected improvements in productivity, reporting, automation, and scalability helps leadership teams understand the long-term return on investment of Microsoft Dynamics 365 Business Central.
What industries typically see the highest ROI from Business Central?
Manufacturing, distribution, construction, retail, and professional services organizations often see the strongest Business Central ROI because these industries frequently rely on manual workflows, disconnected systems, and complex operational processes. Companies with siloed financial and operational data generally achieve the greatest return on investment after consolidating processes into a single ERP platform. However, the biggest driver of Business Central ROI is not industry alone — it is the degree of inefficiency and fragmentation in the organization’s existing systems and workflows. For industry-specific examples, explore Rand Group’s Business Central case studies
Next steps
The March 2026 Forrester Total Economic Impact™ study makes a compelling case for Business Central ROI: 209% over three years, a net present value of $464,000, and a payback period of under six months. Those findings are grounded in real interviews with real organizations. And they align closely with what we see across our own client base — from Cirkul scaling into 13 new retail partnerships in four months, to AGT Products automating 90% of daily order entry.
Business Central ROI is real. The question is whether your implementation is positioned to deliver it. When you are ready to build your own business case, contact Rand Group to start that conversation.